Key highlights:
- Bitcoin is closing 2025 below expectations, even after ETFs, institutional buying, and a pro-crypto backdrop created ideal conditions for a bull market.
- Bitcoin’s RSI relative to gold has reached levels that historically appeared near major cycle turning points.
- The market looks compressed and tired rather than broken, with price action indicating a decision phase rather than a collapse.
Bitcoin is closing out 2025 in a spot that feels uncomfortable no matter which side of the market you’re on.
The BTC price is lower than where the year started, confidence feels thin, and the old narratives that used to explain every move are no longer doing much work. That unease sits at the heart of a growing question across the market: is Bitcoin’s 4-year cycle still playing out, or has something quietly shifted under the surface?
Michaël van de Poppe recently brought that question back into focus by highlighting a detail many traders have brushed aside. Over the past year, gold has clearly outperformed Bitcoin. On its own, that might not seem unusual. But when you line it up with where Bitcoin’s RSI is sitting right now, the comparison starts to feel a lot more meaningful.
The BTC charts indicate the market may be closer to a turning point than the current mood would imply.
Bitcoin versus gold: A pattern that keeps showing up
When you step back and look at the long-term relationship between Bitcoin and gold, a familiar rhythm starts to appear.
In previous cycles, Bitcoin tends to lag behind gold first. That phase usually lines up with tighter conditions, reduced risk appetite, and a general sense of uncertainty across markets. Once Bitcoin’s relative strength weakens enough, the relationship flips.
It’s crucial: Is the $BTC 4-year cycle still alive and where are we in the current cycle?
There’s a certainty: Gold has significantly outperformed #Bitcoin over the past year.
That’s what we discussed with @danheld in our recent episode:https://t.co/U4U2auKJul
The current… pic.twitter.com/m1Xvyli4py
— Michaël van de Poppe (@CryptoMichNL) December 24, 2025
Right now, Bitcoin’s RSI against gold has dropped to its lowest level since major bottoms in 2015, 2018, and 2022. In each of those periods, Bitcoin underperformed gold in the year leading into the low. And in every case, the year that followed told a very different story, with Bitcoin significantly outperforming while gold cooled off.
That doesn’t mean prices reverse overnight or that a rally is guaranteed tomorrow. What it does indicate is that the pressure Bitcoin has been under may be cyclical rather than structural. Markets have a habit of feeling most broken right before they start to change.
On-chain data points to caution, not panic
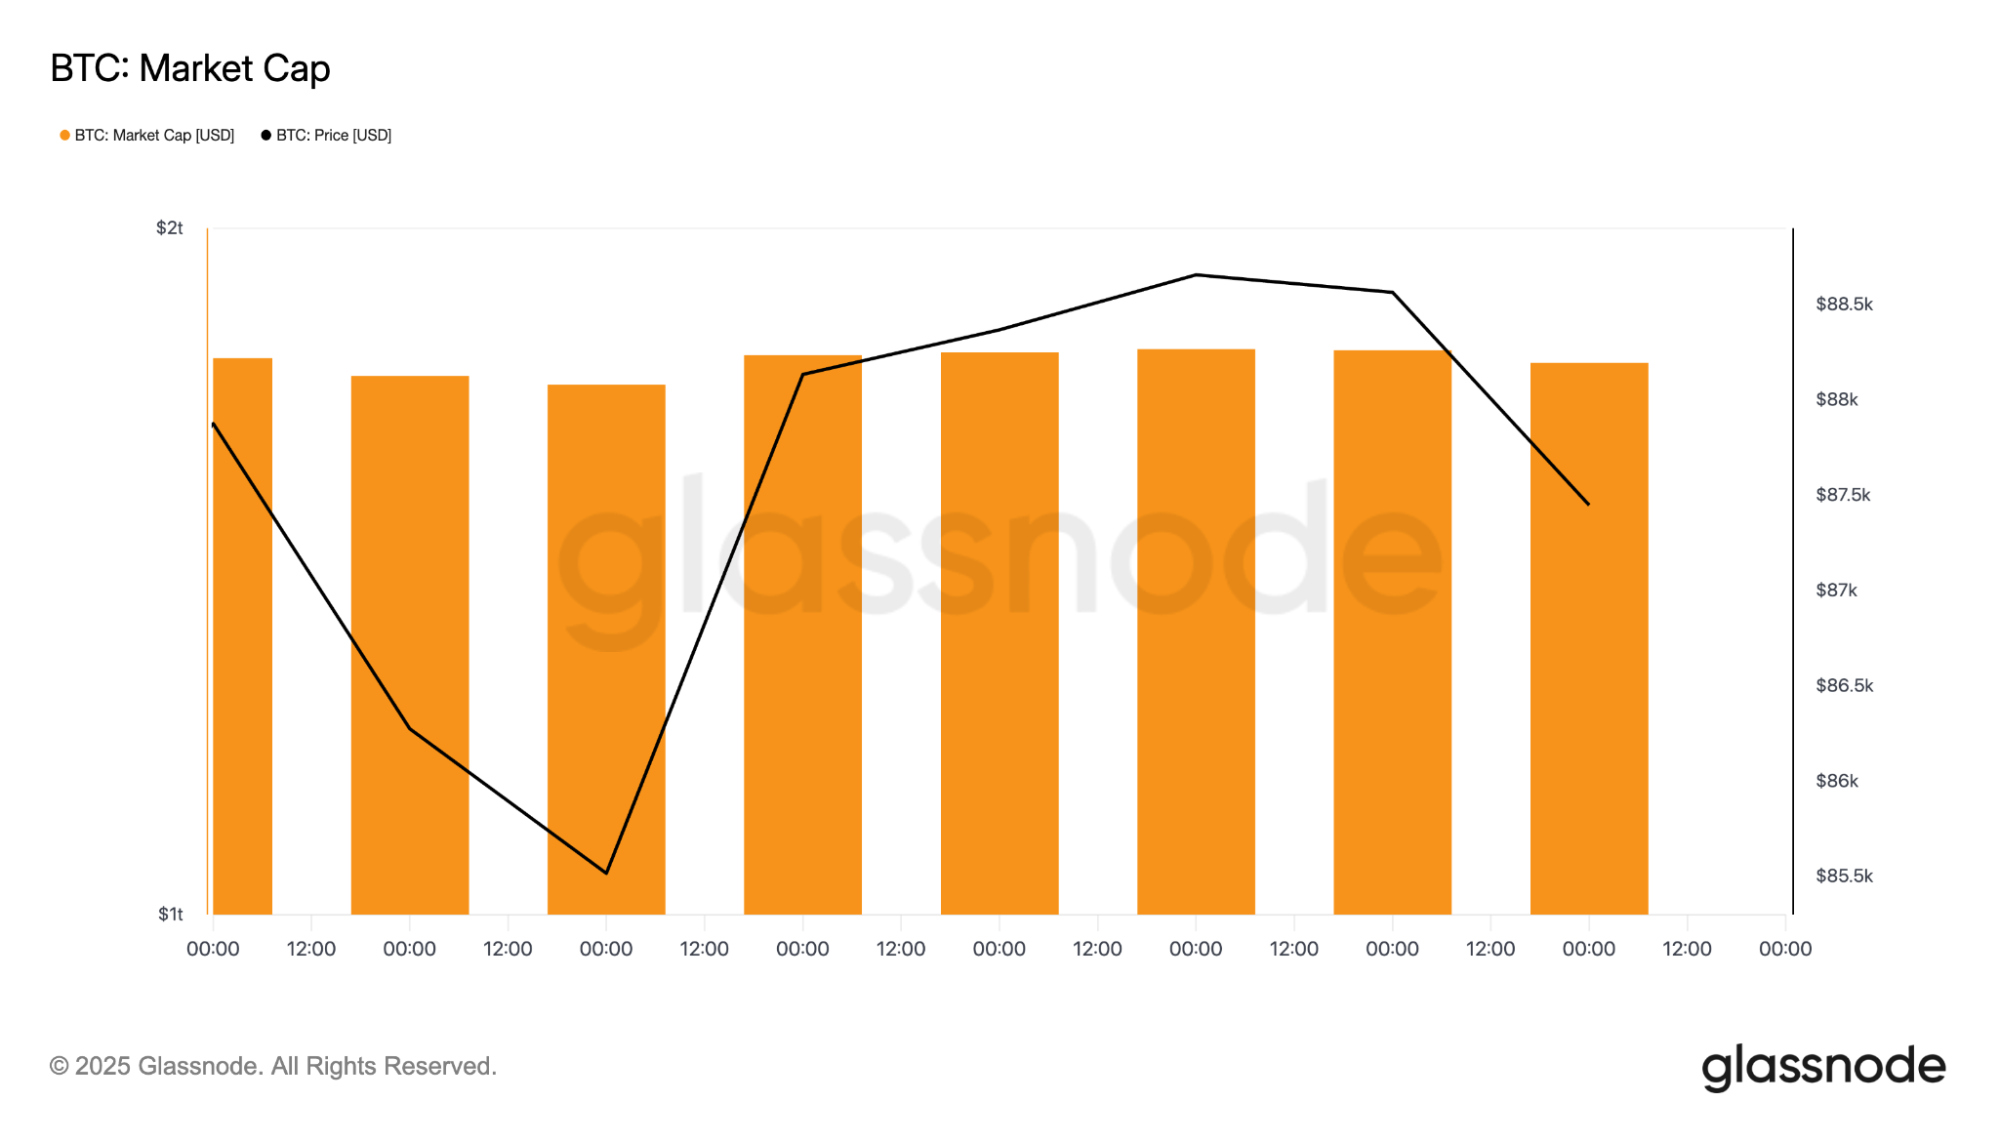
On-chain metrics add important context. Glassnode data shows Bitcoin’s market cap holding relatively steady compared to price swings, which indicates distribution rather than panic-driven selling.
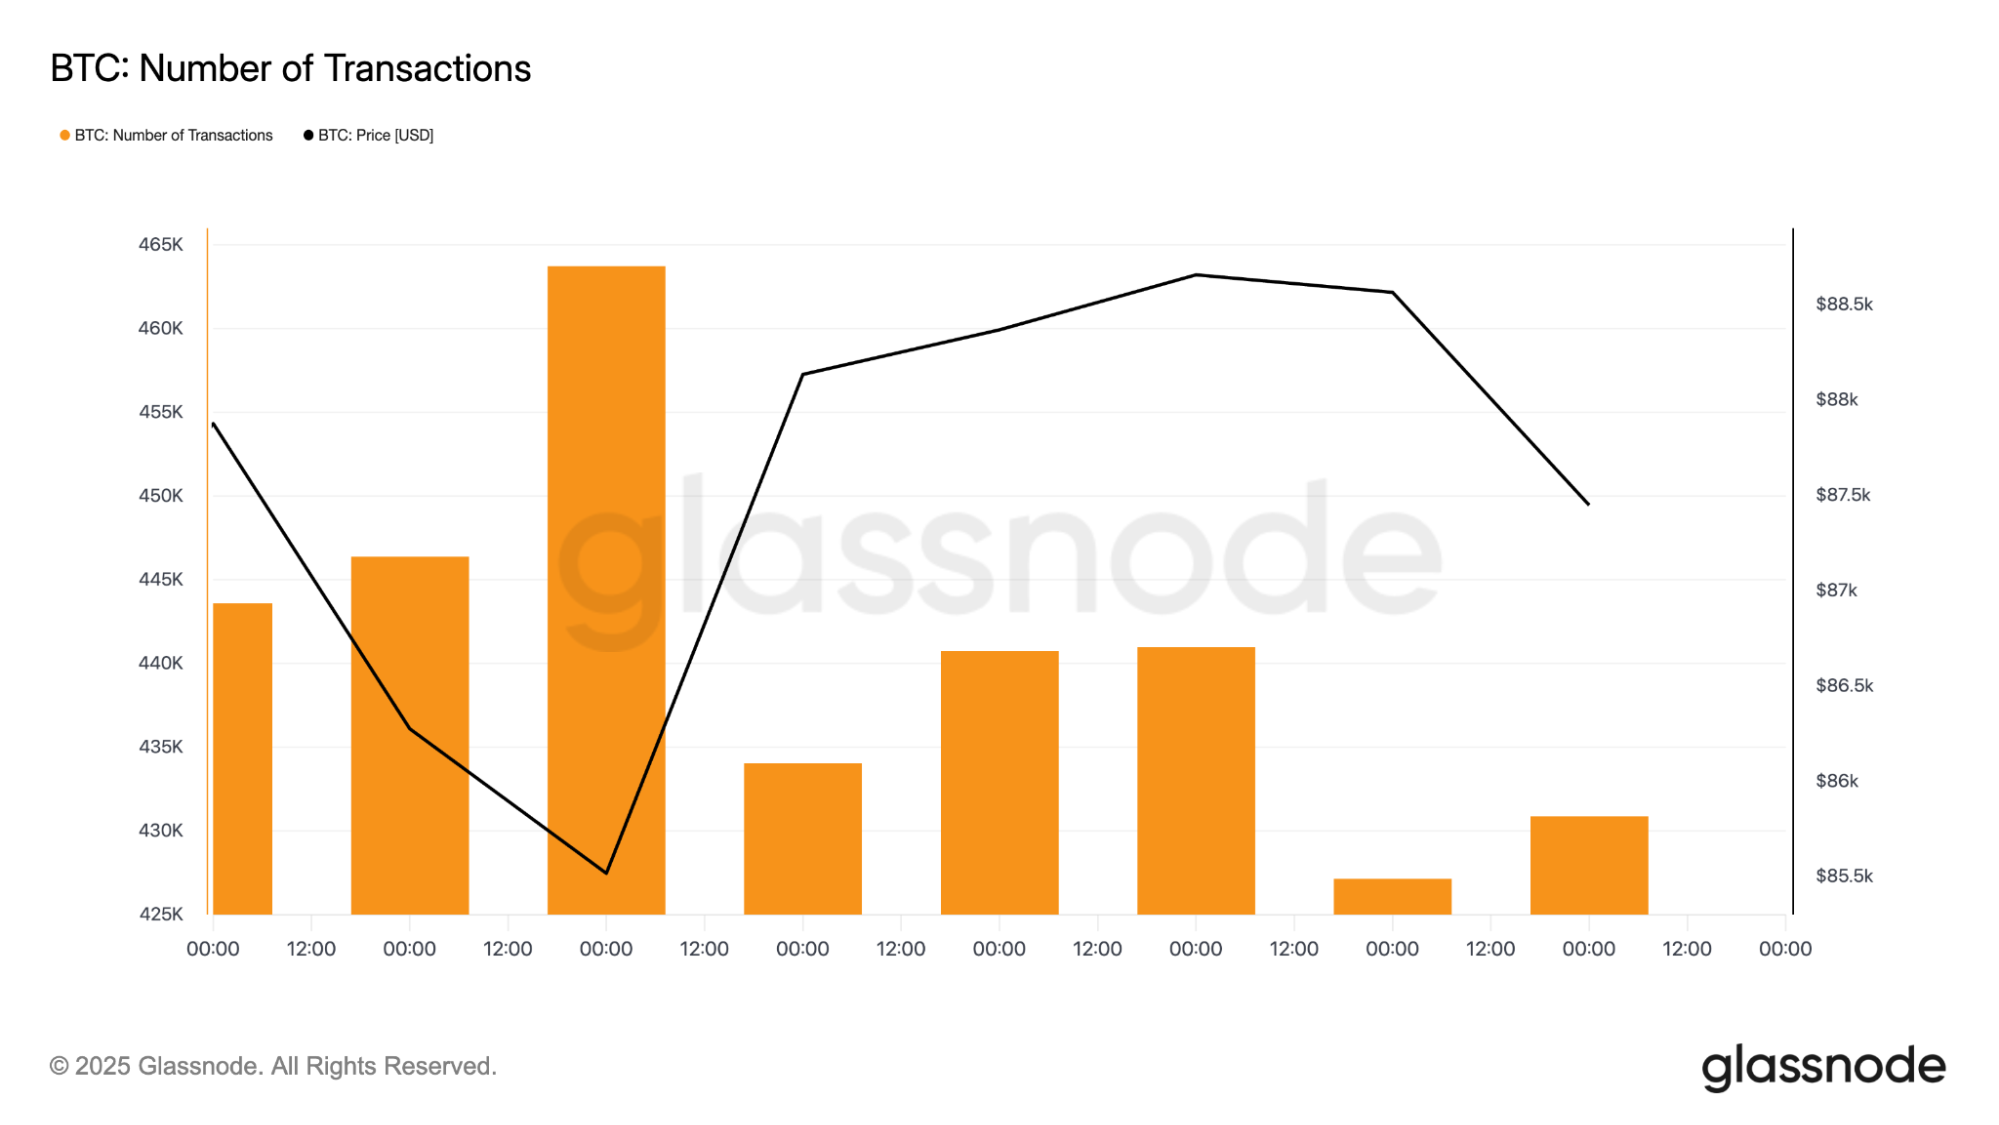
BTC active addresses and transaction counts continue to fluctuate, but there’s no clear expansion trend yet. In past cycle lows, on-chain activity often compresses before rebuilding.
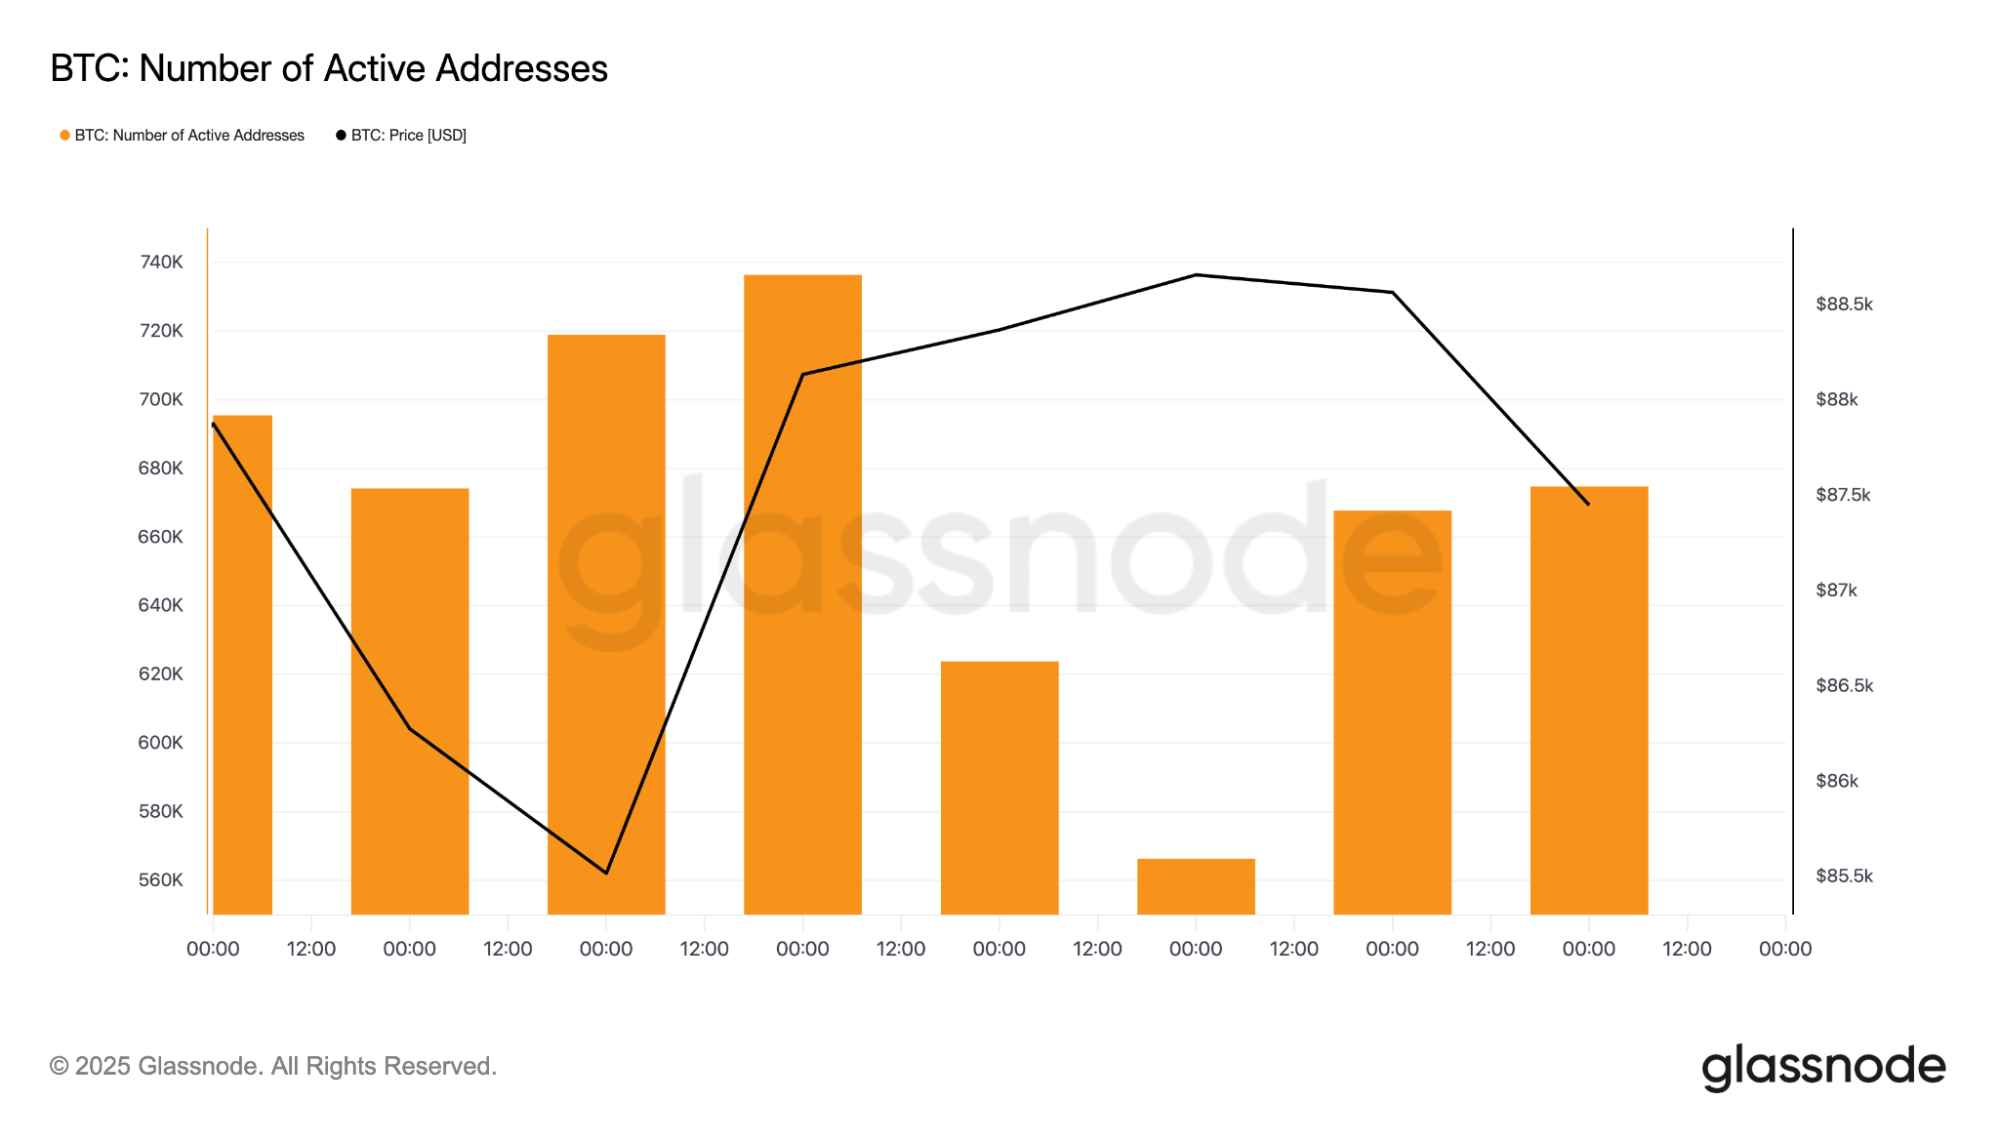
Right now, activity appears to be stabilizing rather than accelerating. That fits a market that’s waiting for clarity instead of rushing for exits. It also matches the broader sentiment. Traders aren’t aggressively chasing upside, but they’re not abandoning positions either.
A year defined by extremes, not momentum
Reflecting upon the year 2025 and the reasons that have caused confidence to be rocked to such an extent in the cryptocurrency market, it should not be forgotten that 2025 started off with Bitcoin fluctuating around late 2024 figures.
However, this mood did not last for long. From February to the middle of April, the price of Bitcoin plunged towards the lower levels around $80,000. The altcoins, however, were more adversely affected, and the dominance of Bitcoin went above 60%.
There was no dramatic collapse or headline event. Selling pressure just kept showing up, and liquidity slowly dried up. What followed looked like a recovery on the surface, but it was narrower than many expected.
Bitcoin held strong, but the broader market never fully joined in
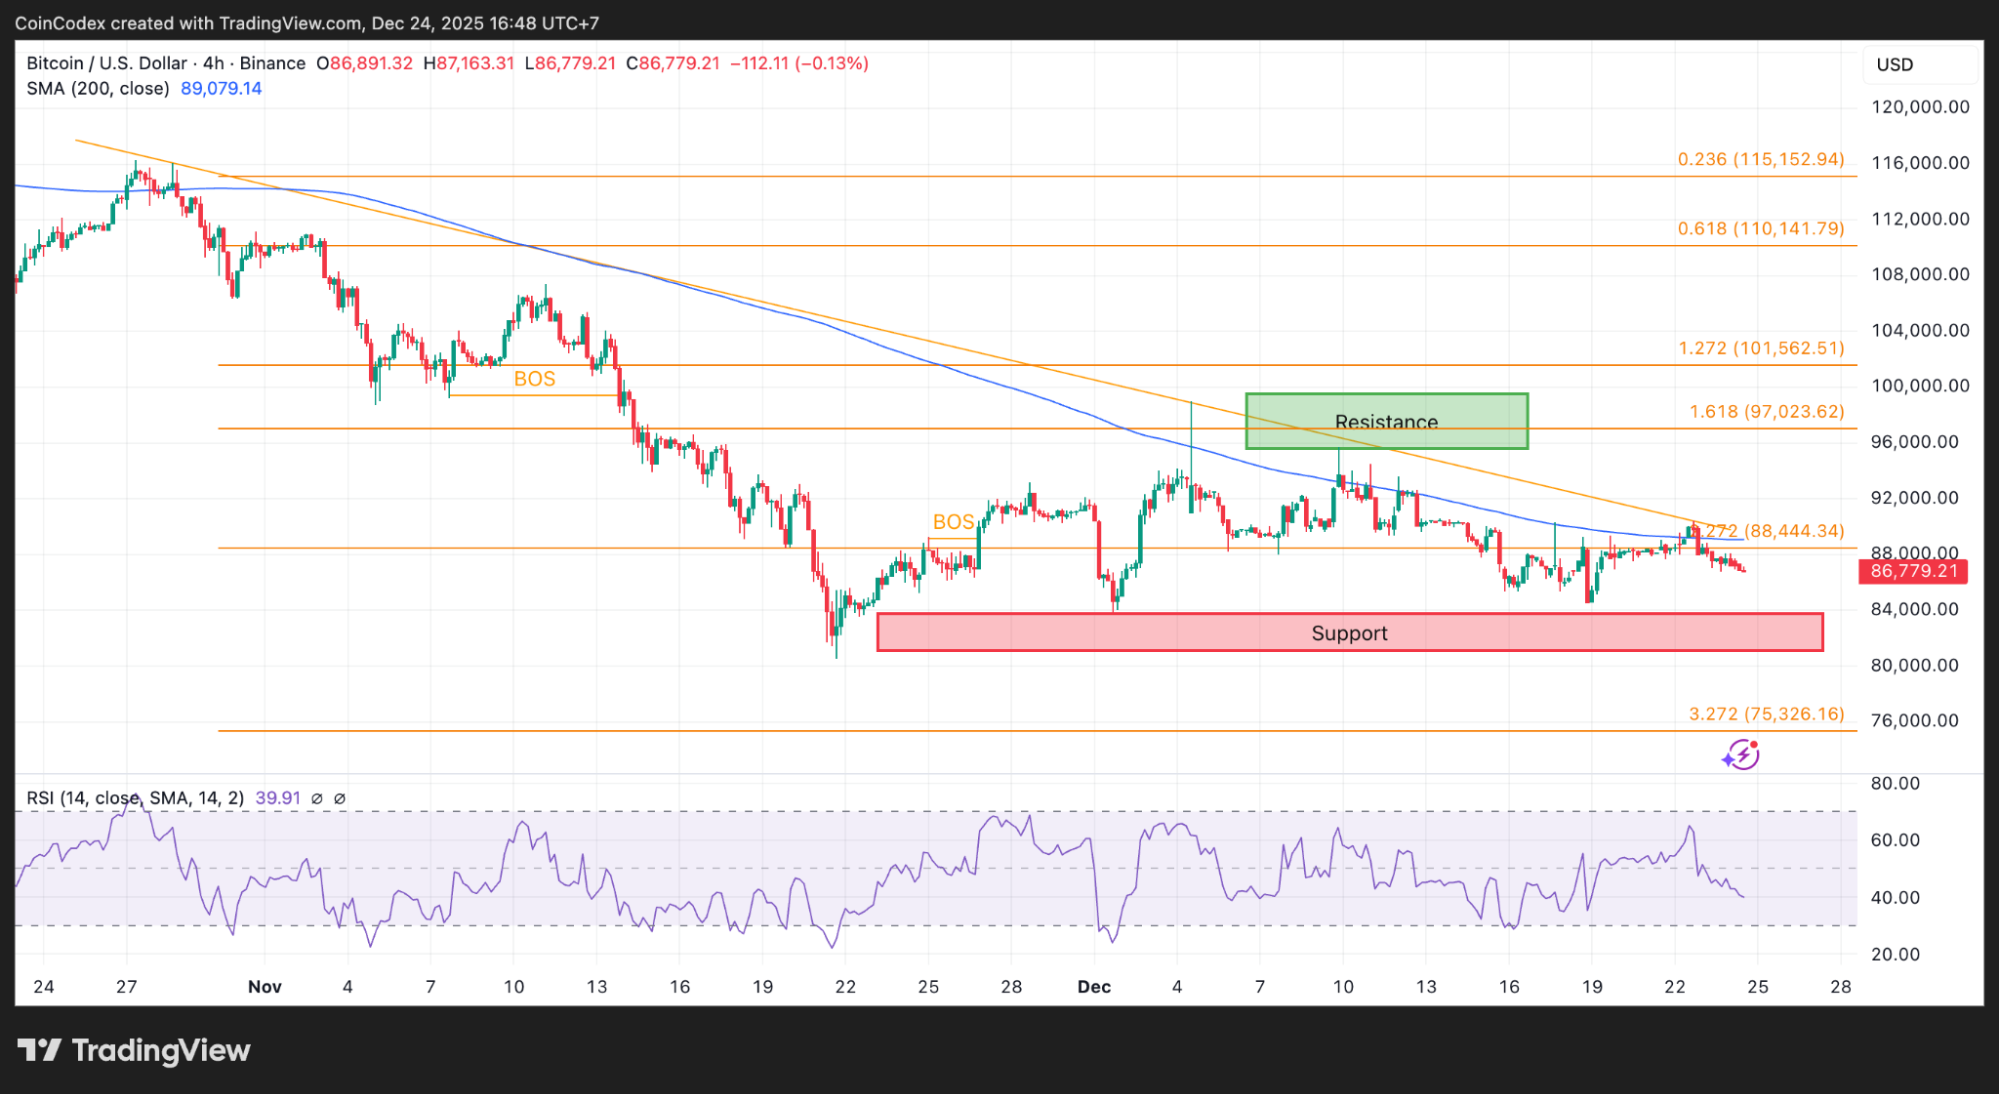
4-Hour BTC price chart analysis.
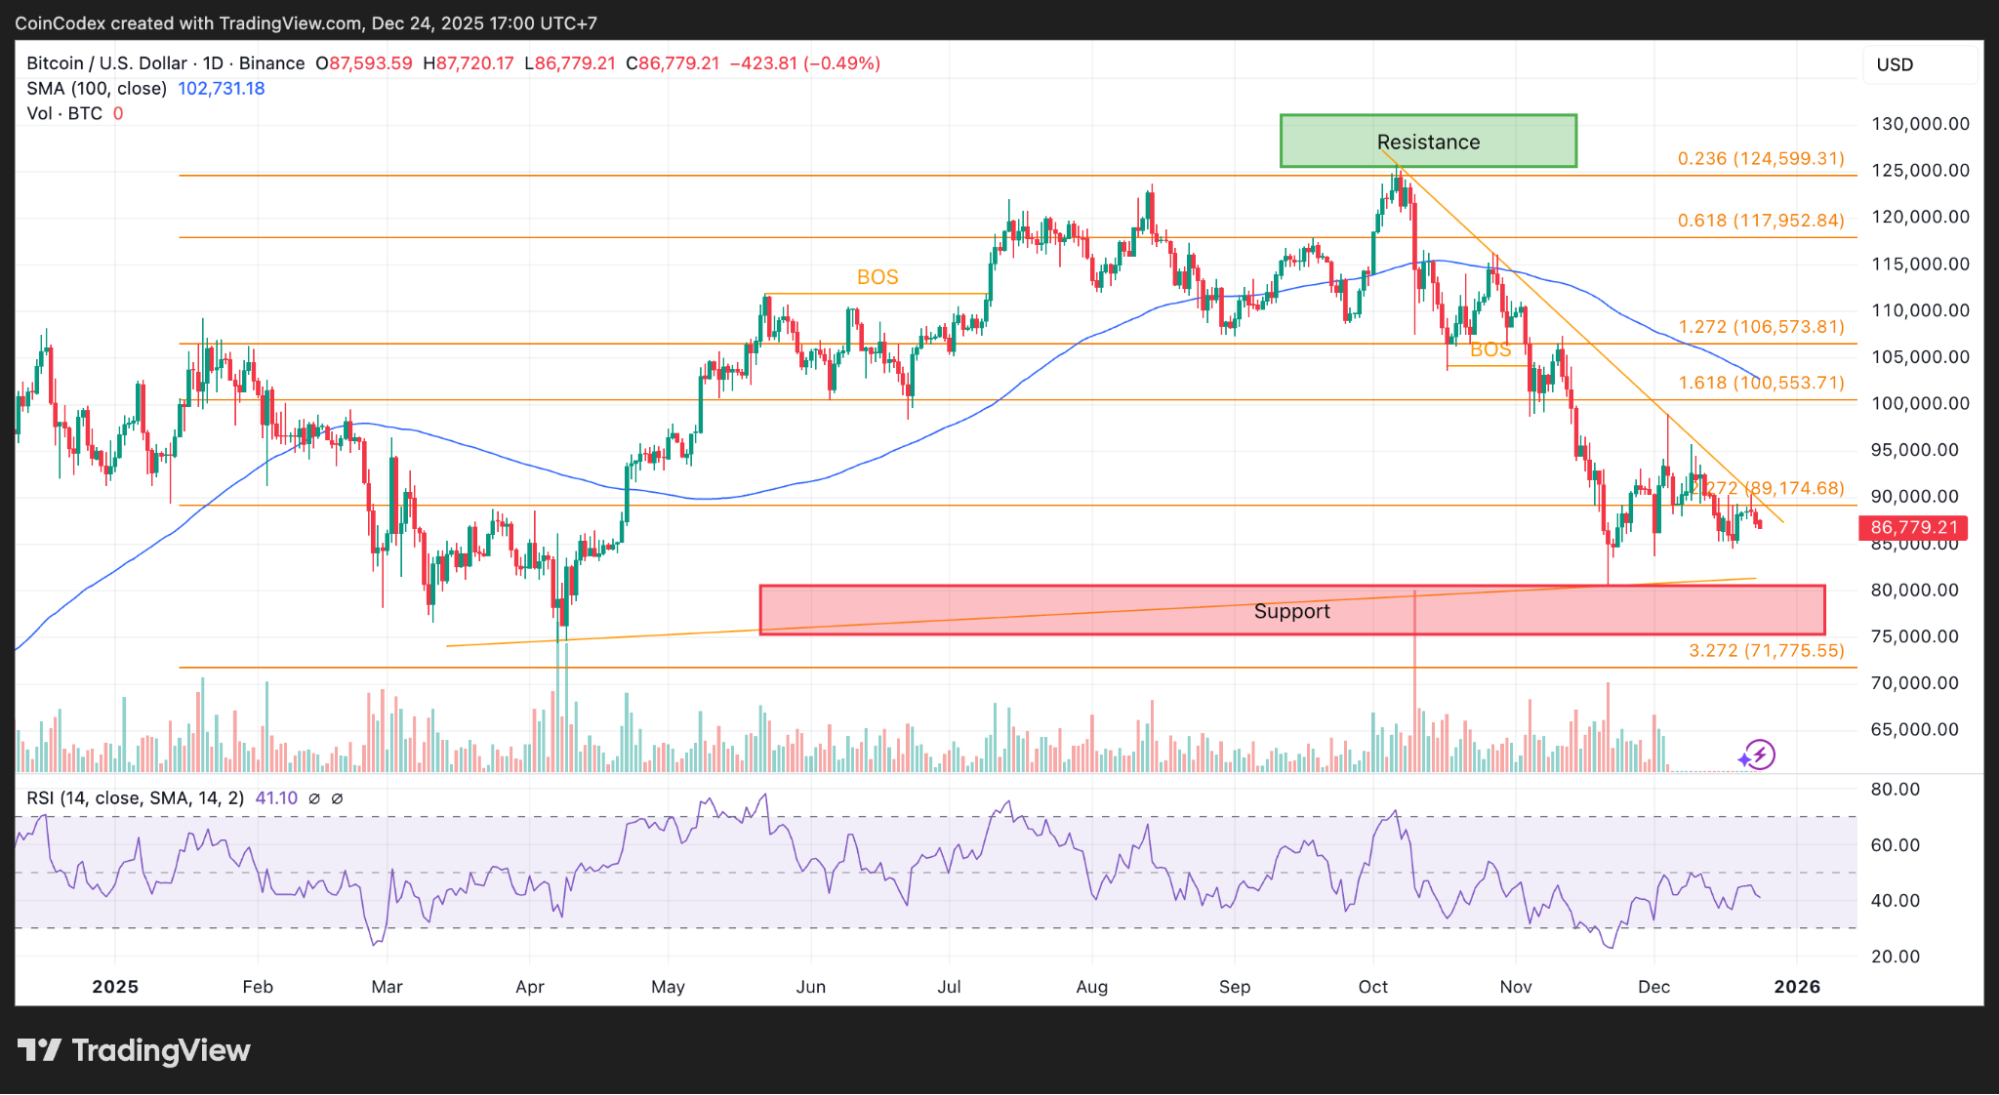
Daily BTC price chart analysis.
The price of Bitcoin went on to regain levels above $100,000 in July, inching towards $110,000. The market cap also moved above $3.4 trillion, and the news was cautiously positive. However, this felt like something was amiss.
This phase was driven largely by ETF inflows, corporate buying, and institutional positioning. Retail participation stayed muted, and most altcoins failed to keep pace. Capital wasn’t rotating outward into risk. It was clustering around Bitcoin. That distinction matters. Strong bull markets usually spread momentum across the market. This one felt defensive, even while prices were rising.
Then came August and September, when that narrative was temporarily disrupted. The Bitcoin price made new highs just below $120,000, the total market capitalization approached $4.0 trillion, and the alt season index was at an all-time high. It was as if the cycle logic was back on track. This opportunity was short-lived.
Momentum lost steam in October, but by then, leverage started to unwind, rallies faltered, and selling started to reappear. Bitcoin could not hold levels higher than this, and by December, the overall market cap had retreated back to levels around $3.0 trillion. The euphoria gave way to frustration, and market sentiment switched back to fear.
That pattern is why 2025 was so confusing. All of the ingredients necessary for a sustained bull market appeared to be in place, but nothing fully emerged.
On smaller scales, Bitcoin still appears heavy. On the 4-hour chart, it can be noted that the Bitcoin price is sitting below the 200-period moving average, with continuous rejections at descending resistances. It has been observed that every attempt at bouncing has lost momentum instantly.
The daily chart offers the same kind of information. Bitcoin holds well above the broad support zone, which has absorbed several tests, but the key moving averages have not been regained.
The RSI value remains in the lower mid-40s, indicating weak momentum without penetrating into deeply oversold regimes.
Such an arrangement has the potential to frustrate market participants. It does not indicate an interruption, nor does it indicate an emerging trend.
So, is the BTC 4-year cycle actually broken?
This is where van de Poppe’s framing becomes useful. Markets can deviate from expectations longer than most participants are comfortable with. That doesn’t mean the underlying structure disappears.
The 4-year cycle has never been a perfect schedule. It’s a tendency shaped by liquidity, psychology, and capital rotation. Each time Bitcoin’s RSI against gold reached levels similar to today, the turning point arrived after maximum frustration, not during confidence.
If that pattern holds, Bitcoin may be closer to the end of its underperformance phase than the beginning. That doesn’t promise immediate upside, but it does challenge the idea that the market has fundamentally changed.
What’s next for Bitcoin?
The coming months will likely decide whether 2025 stands as an anomaly or simply another messy chapter in a familiar cycle.
According to CoinCodex’s Bitcoin price prediction, BTC could work its way toward the $100,558 area over the next 3 months. That said, it really comes down to whether BTC can regain momentum and hold above nearby resistance.
If buyers manage to do that, the path higher stays open. If not, price could remain stuck in this choppy range a bit longer before making a clearer move.
For now, the charts point to a market that feels tired, compressed, and uncertain. Historically, those conditions tend to lead to resolution rather than endless stagnation.
Whether that resolution favors Bitcoin next, or stretches the pain further, is the question the market is quietly waiting to answer.
Kraken: Best crypto exchange for security & reliability
- Buy, sell, and trade 400+ cryptocurrencies with industry-leading security
- Spot, Futures & Margin trading – leverage up to 5x for advanced traders
- Earn rewards with staking on top cryptocurrencies
- 24/7 customer support and high liquidity for fast trades
- Regulated in the US with strong compliance and security measures
- 13+ million users worldwide
Disclaimer: This content is for informational purposes only and does not constitute financial, investment, or other advice. Nothing on this page is a recommendation or solicitation. Always seek independent professional advice before making investment decisions. Some links may earn us a commission at no extra cost to you.
Source:: Bitcoin Price Analysis: Is the 4-Year BTC Cycle Still Alive?