Key highlights:
- The SOL price is pressing into a long-term resistance trendline that has capped every recent recovery attempt, making this level critical for the next move.
- On-chain data shows cooling activity rather than capitulation, indicating consolidation as SOL trades near a decision point.
- A confirmed breakout could shift momentum higher, while rejection keeps downside risks in focus around key support zones.
Solana is once again at an important moment on the chart. After weeks of choppy trading and failed recovery attempts, the price is now pressing directly into a resistance trendline that has capped every meaningful bounce.
Analyst Ali Martinez summed it up clearly by saying this resistance trendline is the key decision point for Solana, and when you look across multiple timeframes, that statement holds up.
Currently around $126.18, the SOL price is stuck between a well-established support level below and a declining resistance line.
Momentum has decayed, volatility has condensed, and there’s no dominant force pushing in either direction. Solana is essentially ranging at the moment; this is one of the most reliable precursors for an even larger move.
Why this SOL resistance trendline is so important
On the 1-hour chart shared by Ali, Solana is respecting a clean descending trendline that has rejected the price several times. Each bounce attempt has failed slightly lower than the last, creating a clear pattern of lower highs. This is often a sign that buyers are struggling to regain control.
This resistance trendline is the key decision point for Solana $SOL. pic.twitter.com/T7G5sE5IN9
— Ali Charts (@alicharts) December 22, 2025
What makes this level more important is that it is not isolated to one timeframe. The same resistance zone lines up closely with levels visible on the 4-hour and daily charts. When resistance aligns across timeframes, it tends to act as a stronger barrier.
A possible breakout above the trendline will trigger a change in short-term market structure, indicating readiness among buyers to participate actively.
Moreover, any further rejection will strengthen the perception that the current up movements are only correction phases in a broader downtrend.
On-chain data indicates cooling, not capitulation
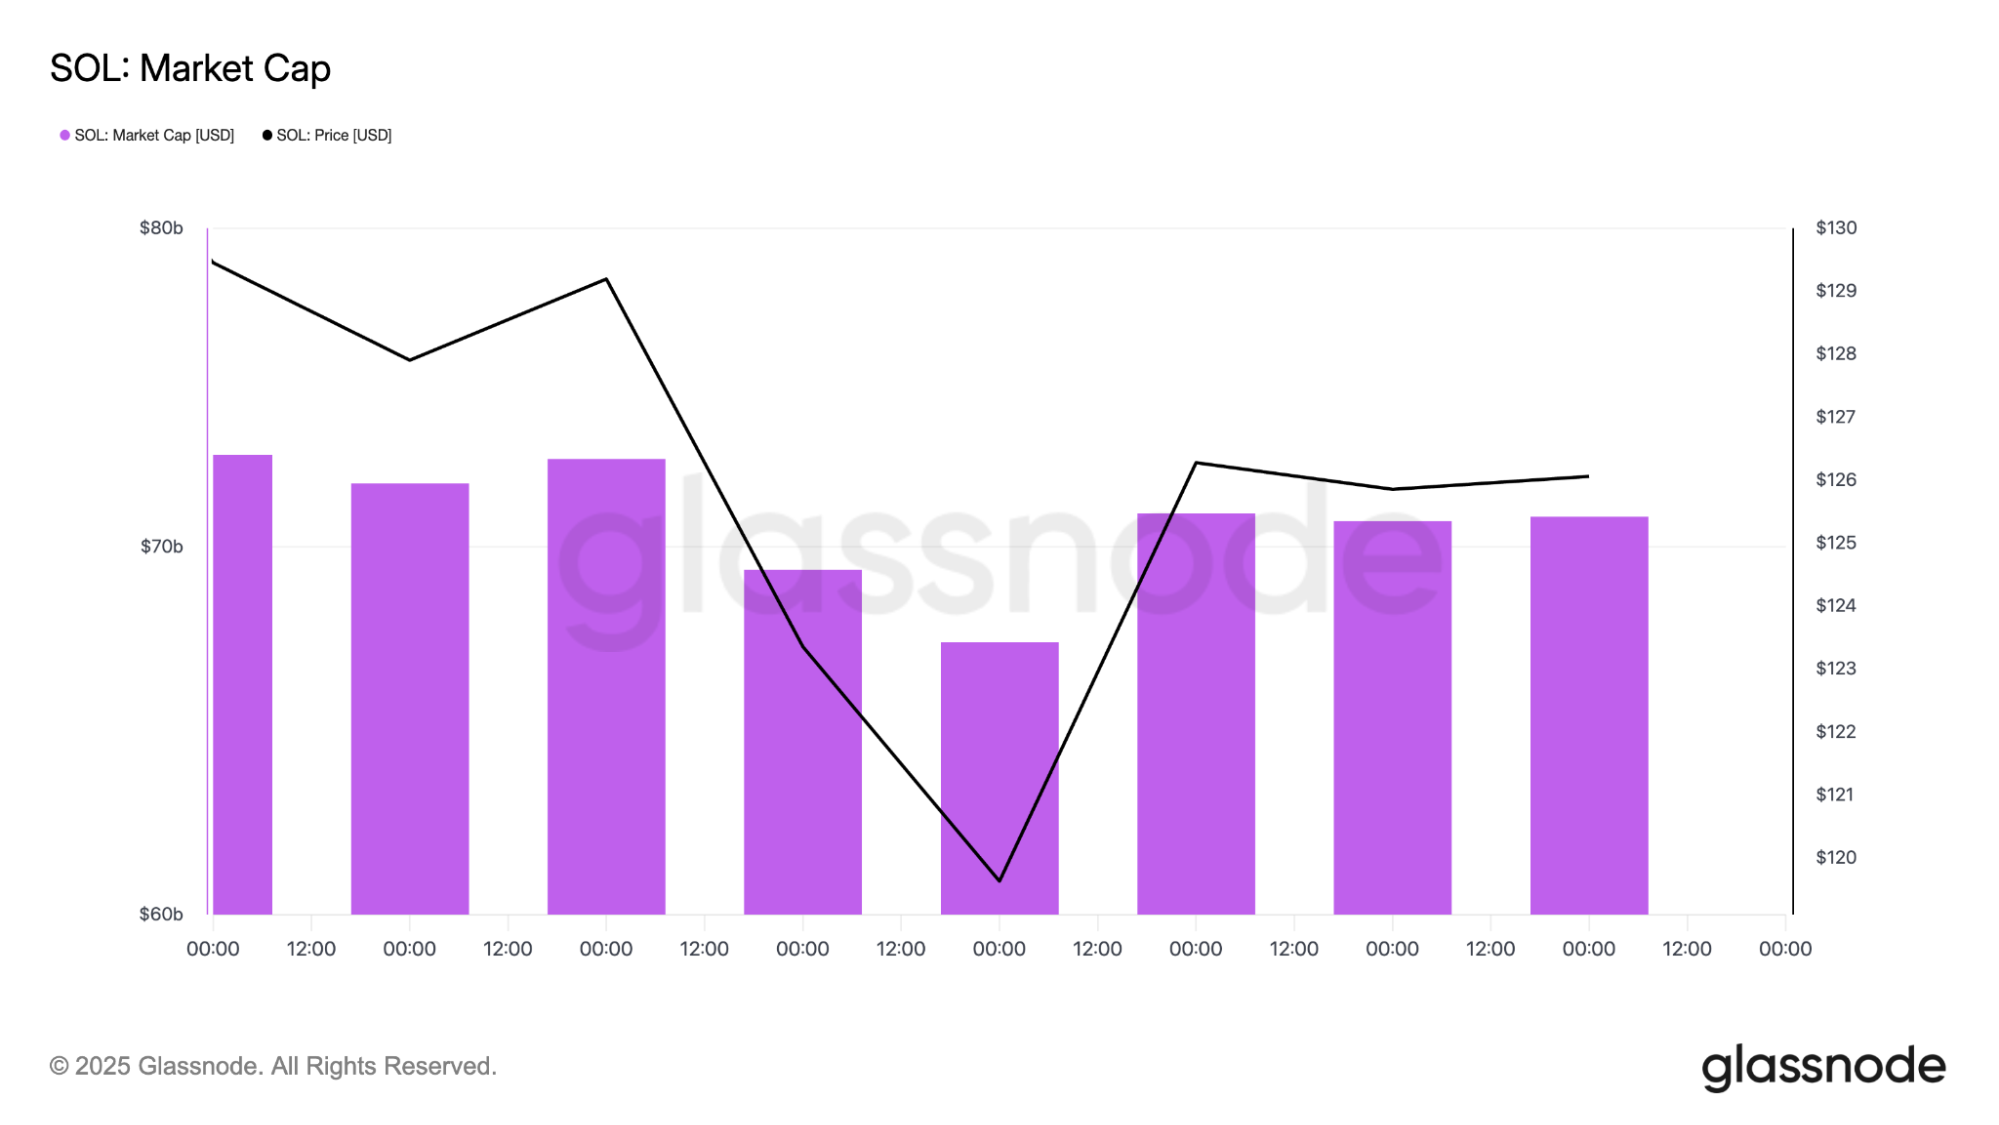
Glassnode provides an important perspective beyond the price. Solana’s market cap has leveled out from the steep decline, staying below highs but not weakening further. It indicates that the bulls are taking a breather, though the price hasn’t yet shown drastic recovery.
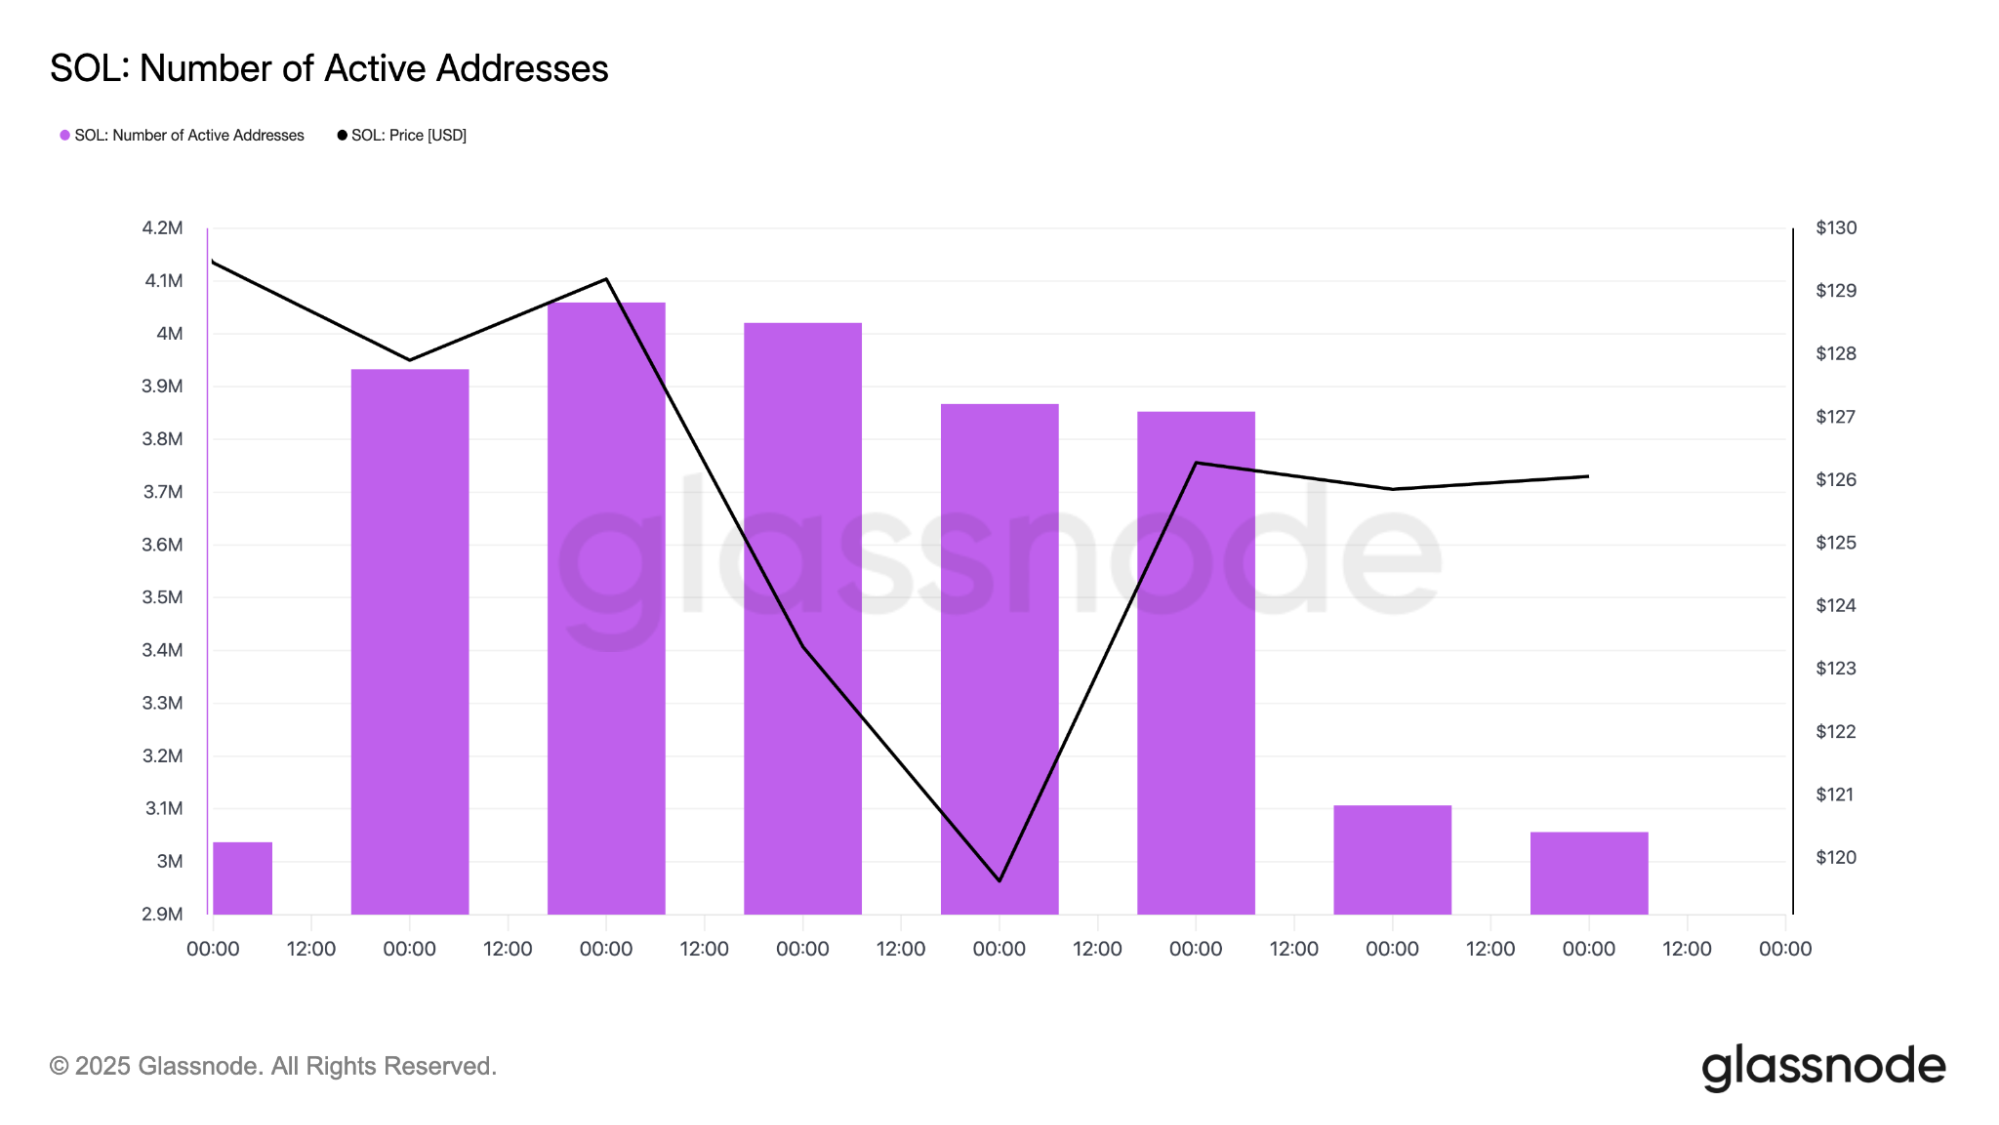
Network activity tells a similar story. The number of active addresses has declined from earlier peaks but remains elevated compared to bear-market lows. Activity cooling is not the same as abandonment. It often signals a shift away from speculation rather than a loss of long-term interest.
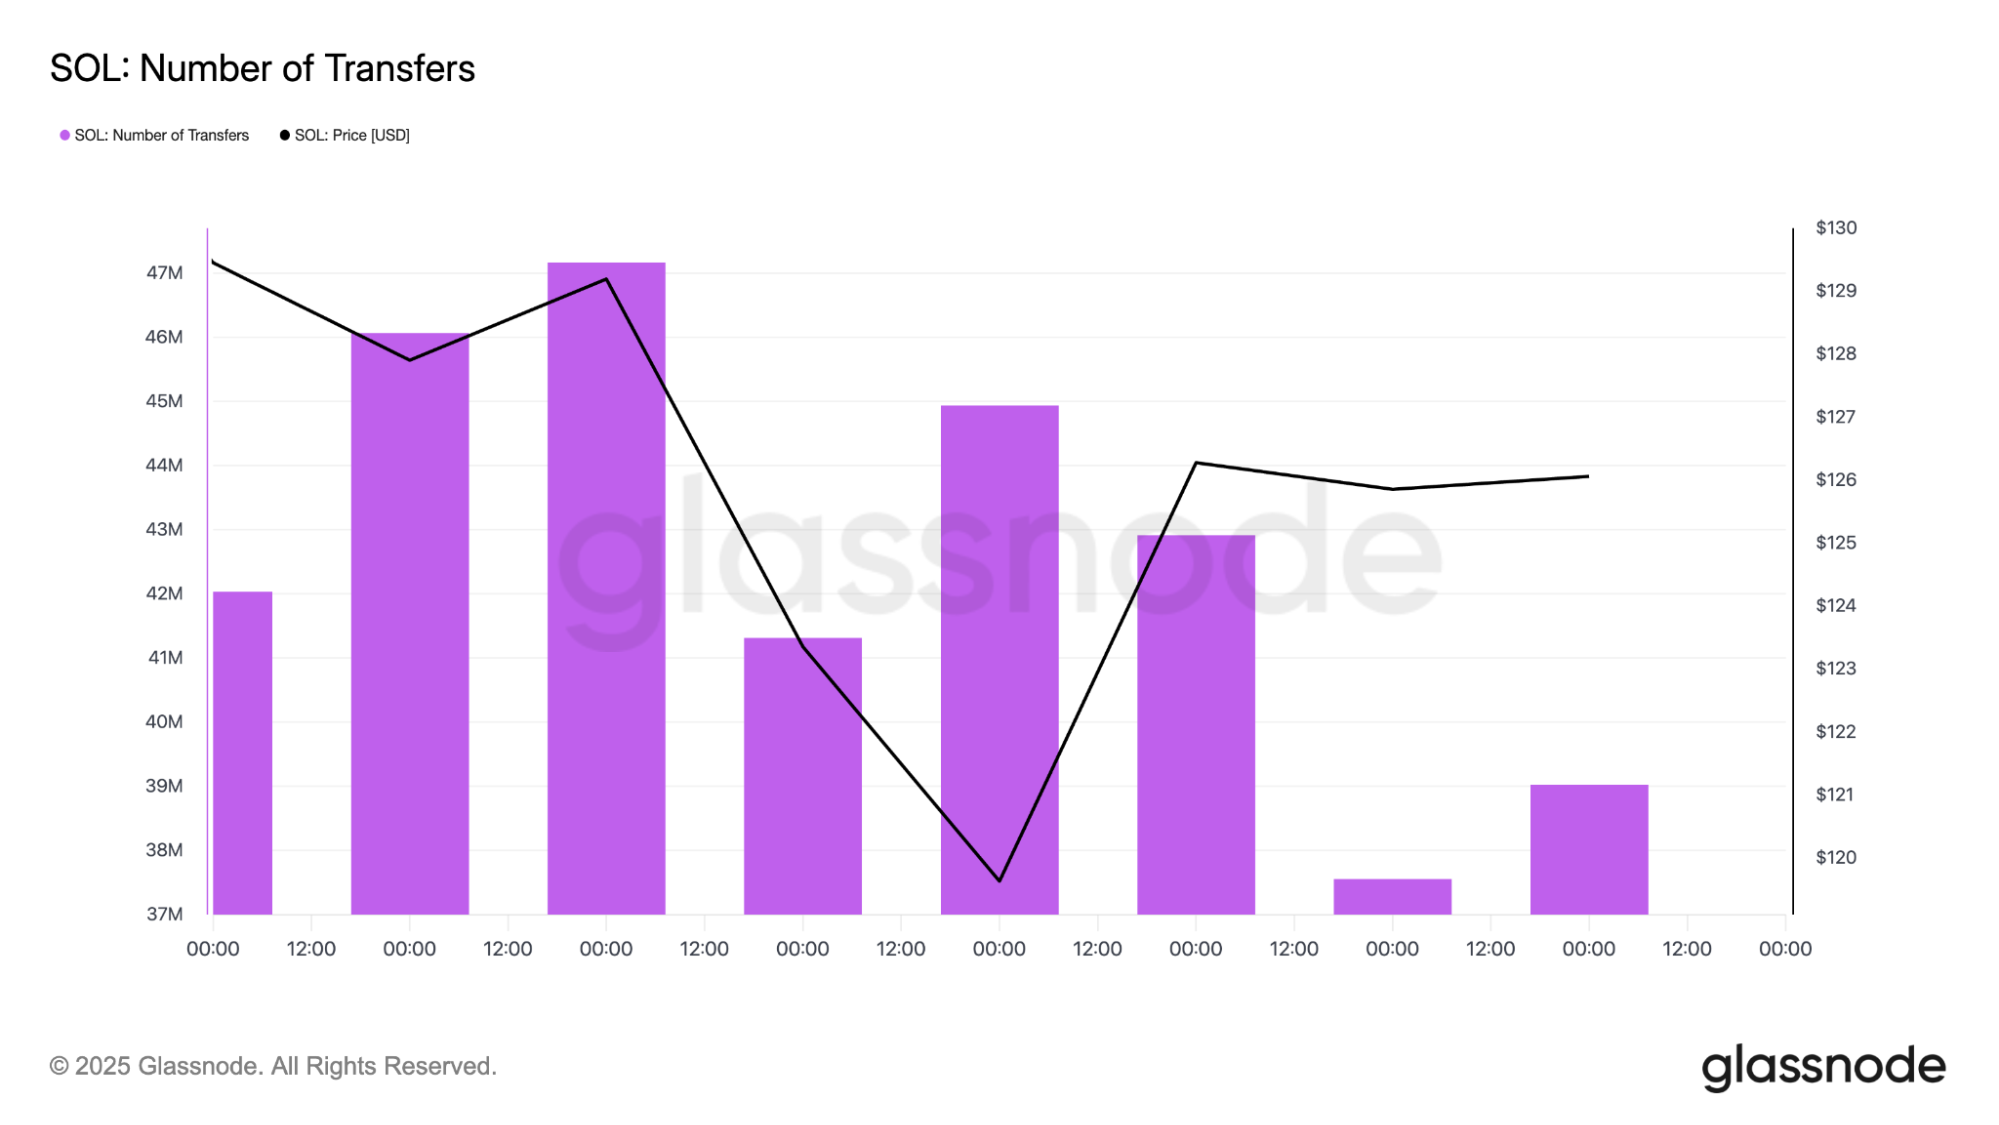
Transfer data reinforces that view. The number of SOL transfers has pulled back alongside price, but the move lower looks orderly. There are no sudden spikes that would indicate panic selling or mass exits from the network.
When you put these metrics together, they point to consolidation rather than collapse. Solana appears to be in a phase where excess has been flushed out, but core usage remains. That matters because sustainable recoveries often start from periods of quiet, not hype.
Still, stable on-chain data does not automatically translate into higher prices. It creates the conditions for a recovery, but price needs technical confirmation. That brings the focus back to resistance.
SOL support holds for now as pressure builds
Looking at the 4-hour chart, Solana continues to hold a broad support zone between roughly $110 and $120. This area has acted as a floor multiple times over the past few weeks, with buyers stepping in each time price dips into the zone.
Support levels tend to lose strength the more often they get tested. While SOL hasn’t broken down yet, each bounce off support has been smaller and less convincing. That lack of follow-through suggests buyers are still defending the level, but without much urgency.
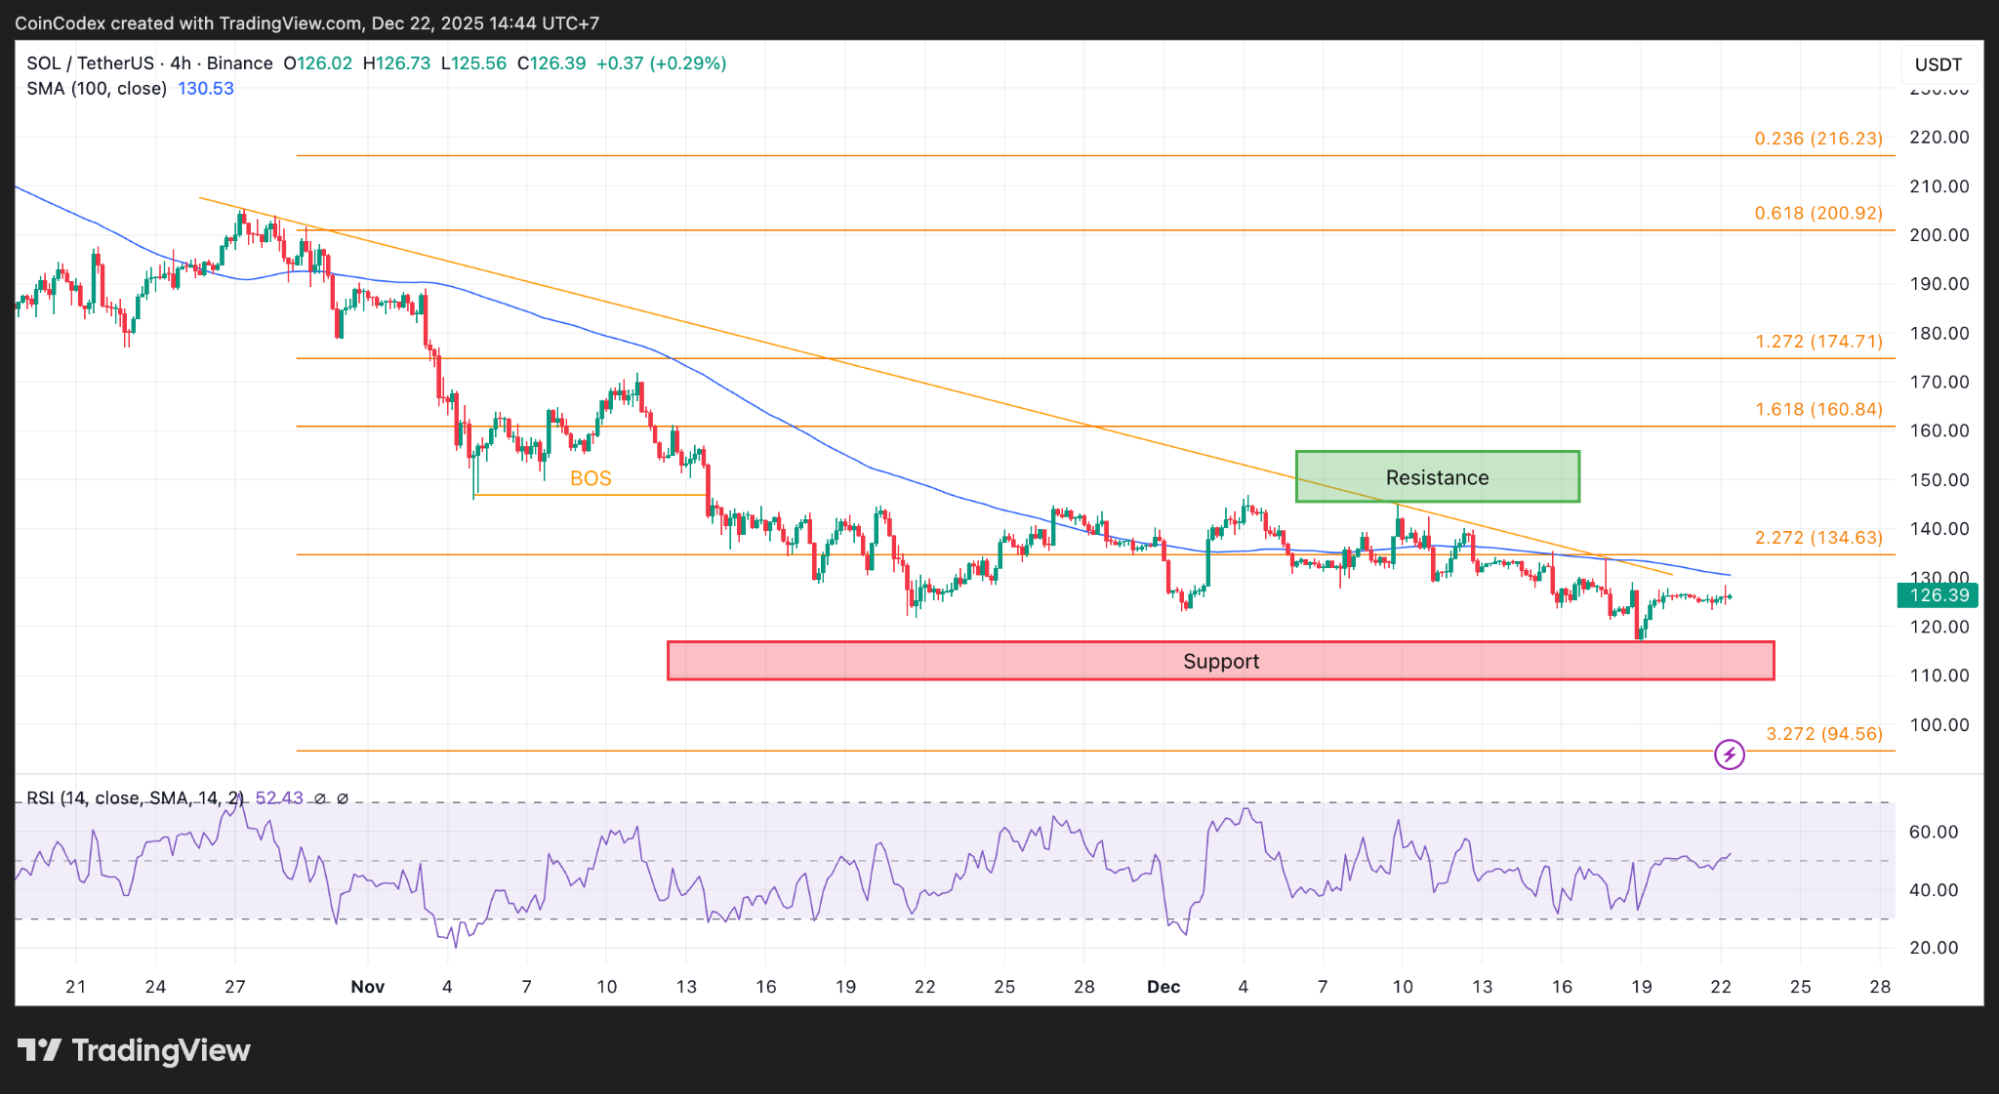
4-Hour SOL price chart analysis.
As long as the SOL price stays above this support zone, the structure remains intact. But if the price is rejected again at resistance and returns to support, the risk of a breakdown increases. Markets rarely give unlimited chances at the same level.
RSI is sitting near neutral, around 52, which shows neither overbought nor oversold conditions. This indicates the market is waiting rather than reacting.
MACD readings remain mixed, with no strong bullish or bearish crossover holding. When indicators flatten like this, they usually follow price rather than lead it. A breakout or rejection at resistance is likely to resolve the indecision quickly.
Solana daily chart shows a market searching for direction
On the daily chart, Solana’s setup looks quieter but just as important. After getting rejected near the $240 to $260 resistance zone earlier this year, the SOL price slid into a longer downtrend before finally finding some stability above the $100 area.
At the moment, SOL is still trading below key moving averages, with the 200-day SMA sitting much higher around $174.57, which keeps pressure on the broader trend. At the same time, downside momentum has clearly slowed, and the selling no longer looks as aggressive as it did before.
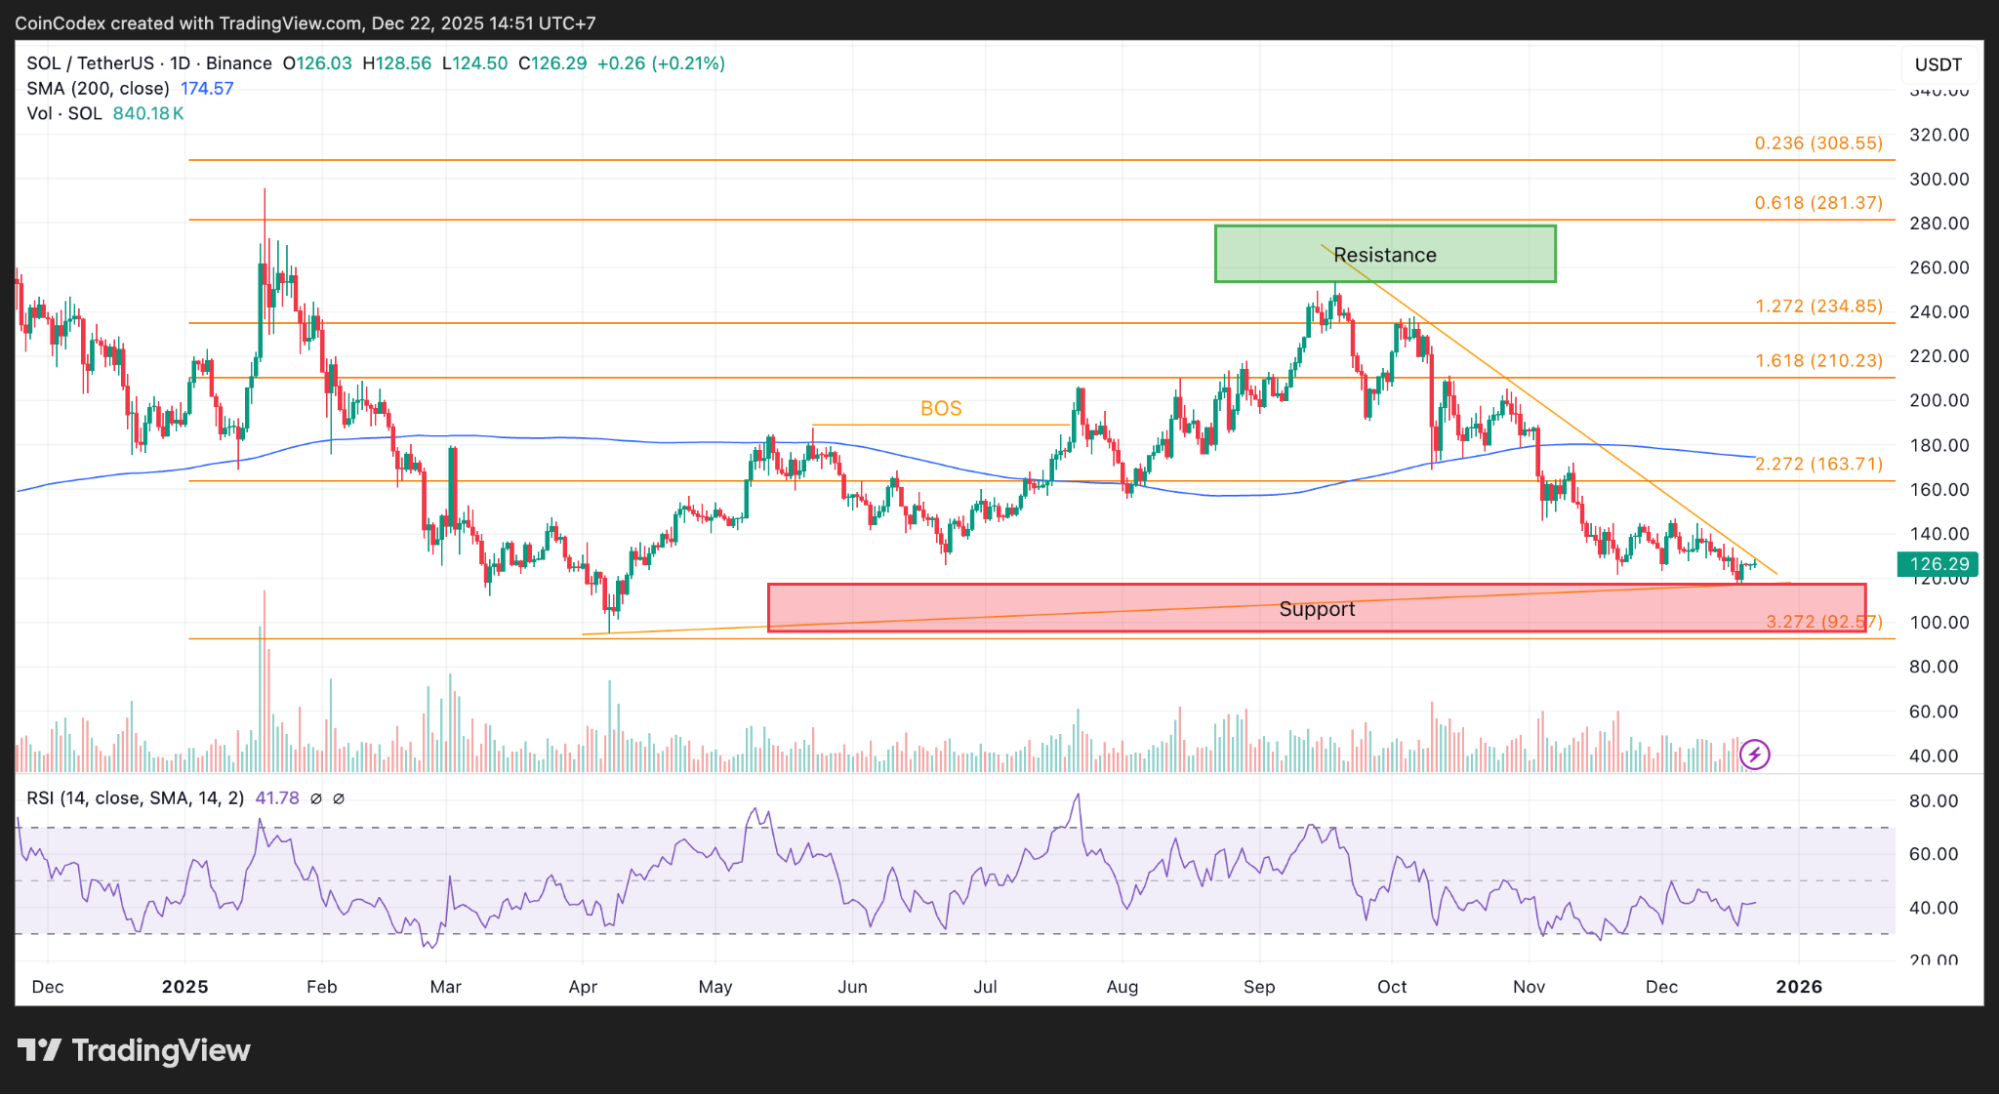
Daily SOL price chart analysis.
This combination often signals a transition phase. The market is deciding whether it wants to build a base and recover, or roll over and continue lower. The resistance trendline highlighted by Ali sits right at the center of that decision.
What a break above resistance would change for SOL
If the SOL price manages to break above the descending resistance trendline and hold above the $135 to $140 area, the short-term picture would improve significantly. That move would break the sequence of lower highs and indicate buyers are regaining control.
According to CoinCodex’s Solana price prediction, SOL could push toward the $160.81 area over the next three months, but only if price breaks through resistance and manages to hold above it. If that move sticks, the next zone to watch sits around $174.71, where higher Fibonacci levels begin to align.
However, breakouts need follow-through. A brief move above resistance followed by a quick rejection would only reinforce the idea that sellers remain in control.
What comes next for SOL?
If SOL gets rejected at resistance again, focus will quickly move back to the $110 to $120 support zone. Another visit to that area would raise the risk of a breakdown, especially if the broader market starts to weaken.
If support gives way, the SOL price could slide toward the $95 to $100 region, which lines up with lower Fibonacci levels and previous demand. That kind of move would indicate the market is distributing rather than building a base.
While this analysis focuses on Solana, it does not exist in isolation. Bitcoin’s next move will play a major role in determining whether SOL breaks out or breaks down. Altcoins rarely make decisive moves on their own.
For now, Solana is sitting at a clear decision point. The resistance trendline highlighted by Ali Charts is not just another technical level. It represents the boundary between recovery and continuation of the downtrend. The next clean move away from this level is likely to define SOL’s direction in the weeks ahead.
Kraken: Best crypto exchange for security & reliability
- Buy, sell, and trade 400+ cryptocurrencies with industry-leading security
- Spot, Futures & Margin trading – leverage up to 5x for advanced traders
- Earn rewards with staking on top cryptocurrencies
- 24/7 customer support and high liquidity for fast trades
- Regulated in the US with strong compliance and security measures
- 13+ million users worldwide
Disclaimer: This content is for informational purposes only and does not constitute financial, investment, or other advice. Nothing on this page is a recommendation or solicitation. Always seek independent professional advice before making investment decisions. Some links may earn us a commission at no extra cost to you.
Source:: Solana Price Analysis: SOL at a Make-or-Break Moment – Here’s Where It Could Go Next