Key highlights:
- Bitcoin’s hovering around $107,500 at the moment after yet another unsuccessful try at breaking through that tough $110K resistance.
- It’s still holding above the 200-day moving average, which is a positive sign, but momentum seems to be fading as it keeps bumping up against that key level.
- If the price drops below $103K, things could get a bit shaky. We might see a drop toward $98K, or possibly even down to $95K in the near future
| Bitcoin price | $107,500 |
|---|---|
| Key BTC resistance levels | $109,000, $110,500, $112,000, $114,300 |
| Key BTC support levels | $103,500, $102,000, $99,000, $97,500, $95,000 |
Bitcoin is down 2.3% this week as the cryptocurrency drops to around $107,500 after failing to break above the $110,000 resistance zone.
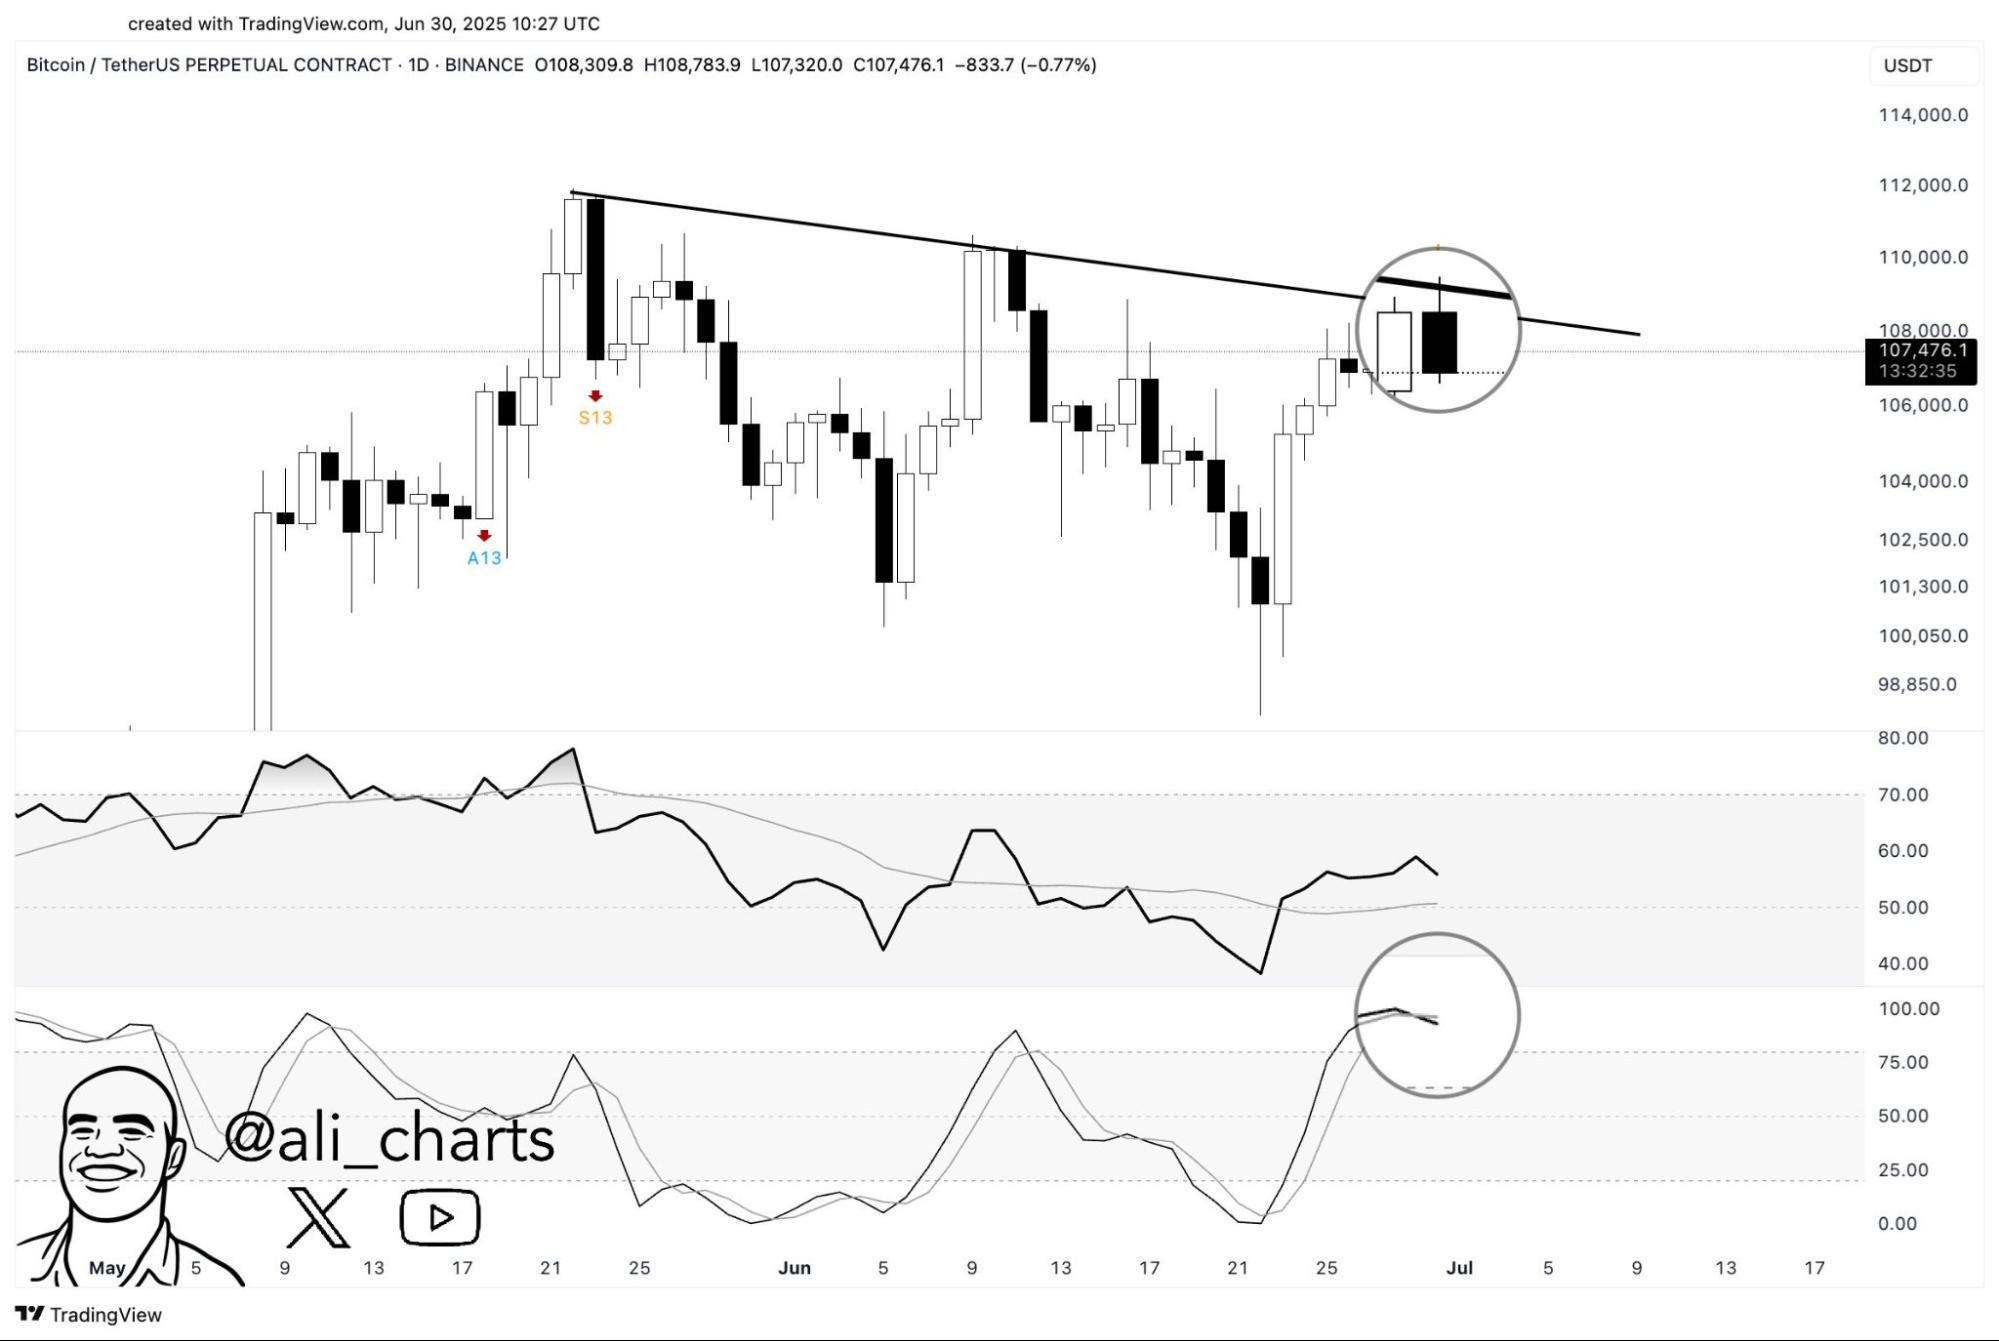
It’s been stuck in a short-term consolidation phase lately, following a strong rally from $101K earlier this month. Despite a few attempts to break through that $110K resistance zone, the bulls just can’t seem to push past it.
Every time Bitcoin gets close, sellers step in and knock it back down, something we’ve seen a few times in recent weeks. The most recent drop started after a failed breakout on June 27, when BTC briefly hit $110,800 before reversing sharply.
That move also lined up with a bearish signal from the Stochastic RSI on the daily chart, which flashed a death cross, often seen as a sign that momentum is turning against the bulls.
Since then, BTC has pulled back and is now hovering just above the demand zone between $102K–$103.5K, which acted as a support earlier this month.
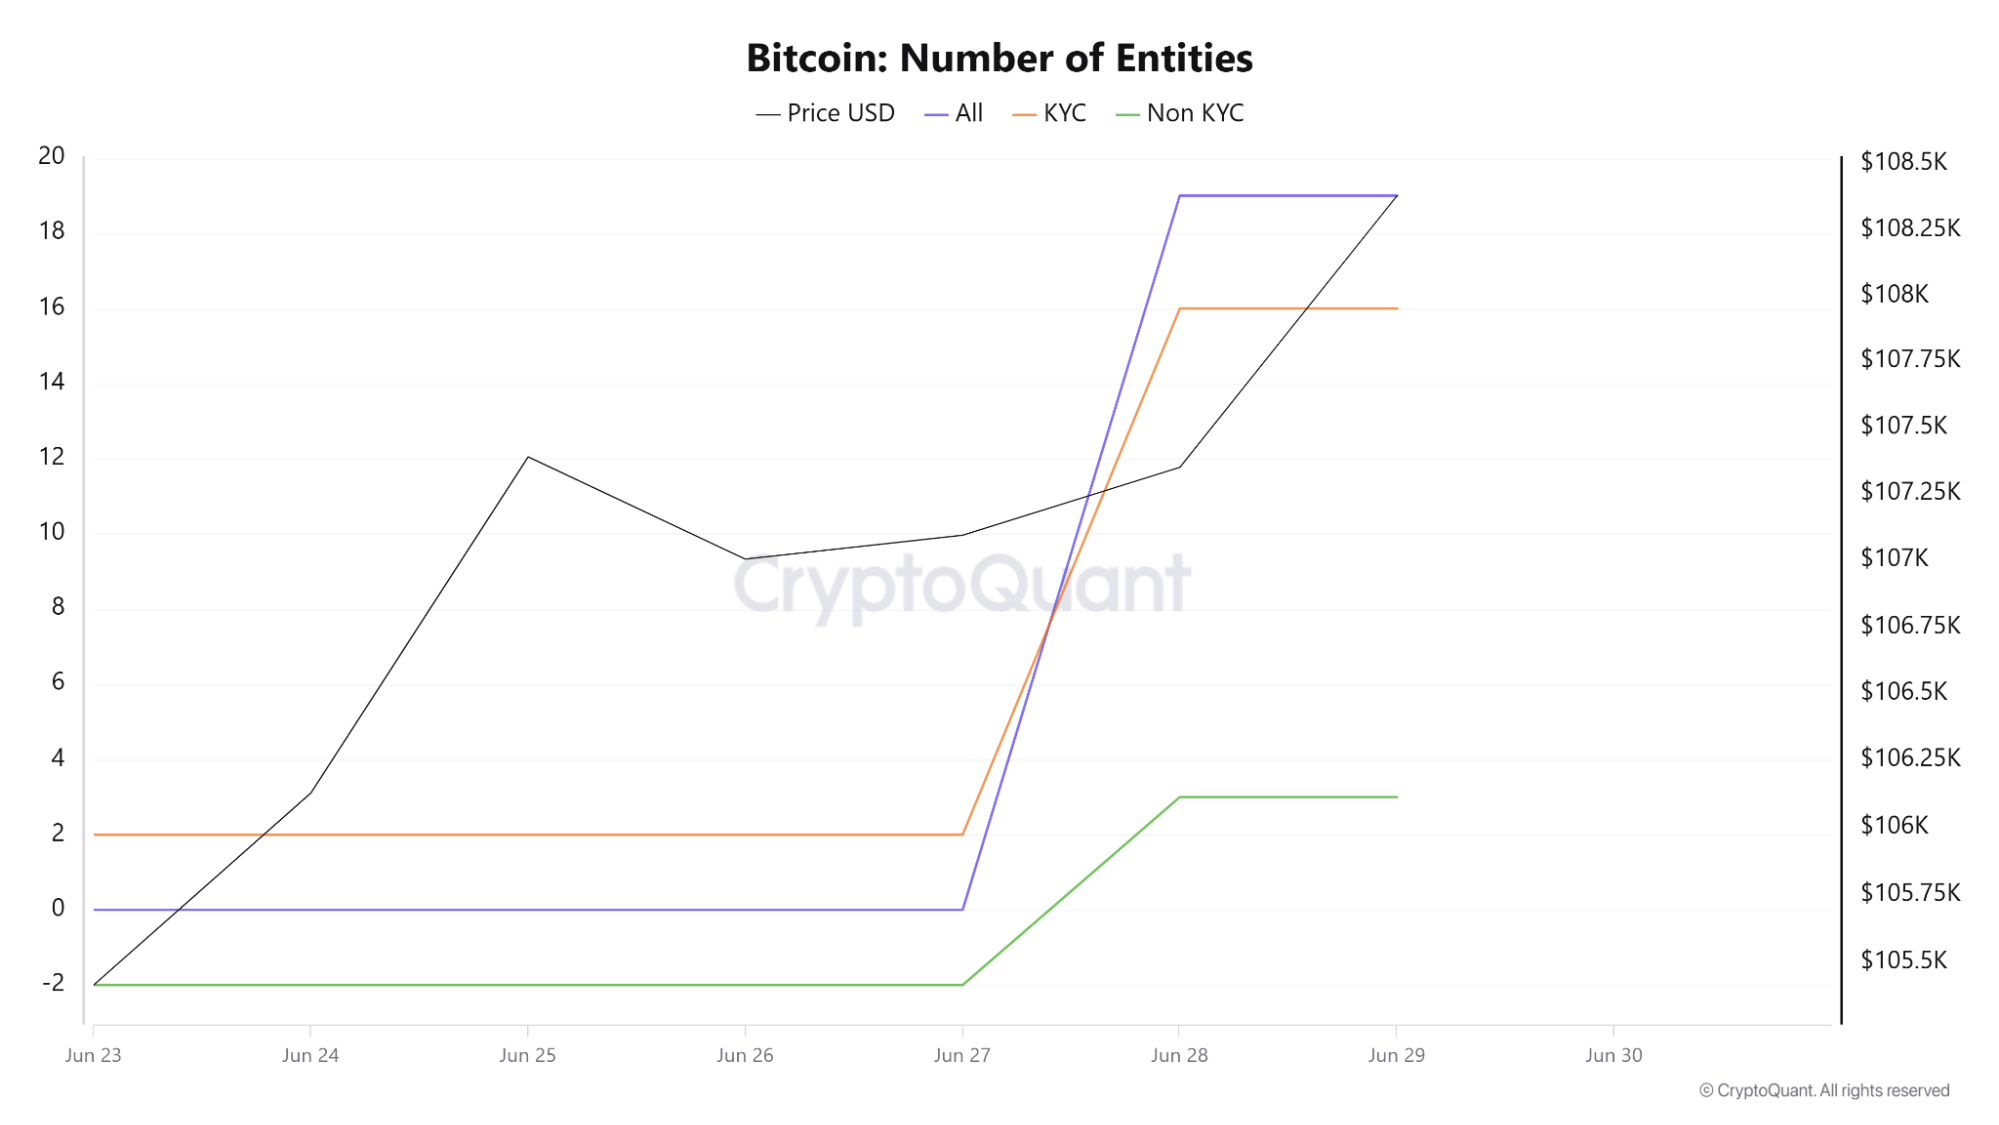
According to Crypto Quant entity and whale behavior metrics, the current rally appears to be institutionally driven. KYC-linked wallets spiked sharply on June 28, aligning with the price rebound.
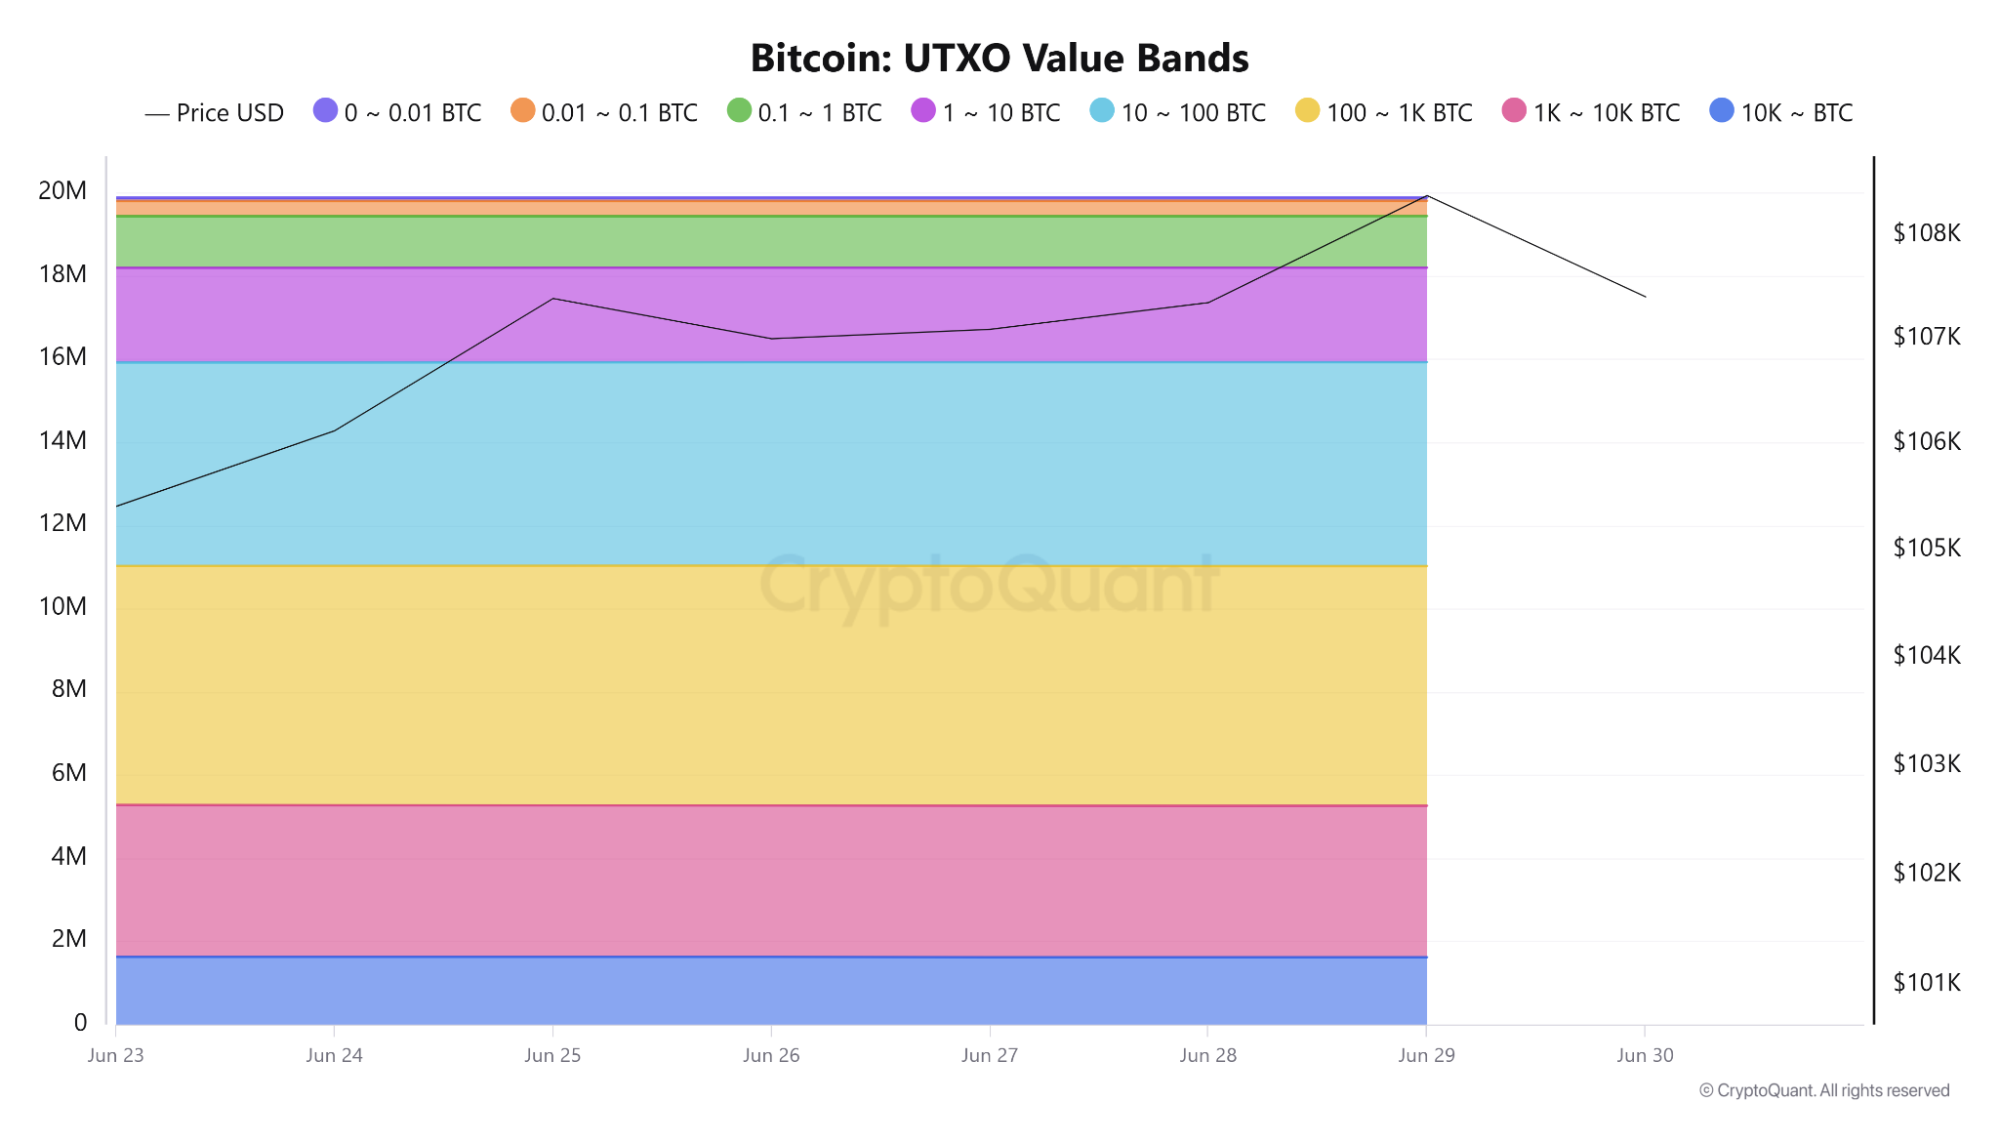
Meanwhile, UTXO data shows mid-sized and large wallets are holding steady, with very little distribution despite recent gains. Retail participation remains flat, confirming the absence of broad speculative FOMO.
Bitcoin is still trading above its 4H and 1D 200-period simple moving averages, sitting around $105,739 and $96,262, respectively.
As long as these dynamic support zones hold, the broader uptrend remains intact. However, the battle between bullish structure and resistance overhead is still ongoing.
Bitcoin Price Analysis
Daily chart
4-hour chart
Where Do We Stand?
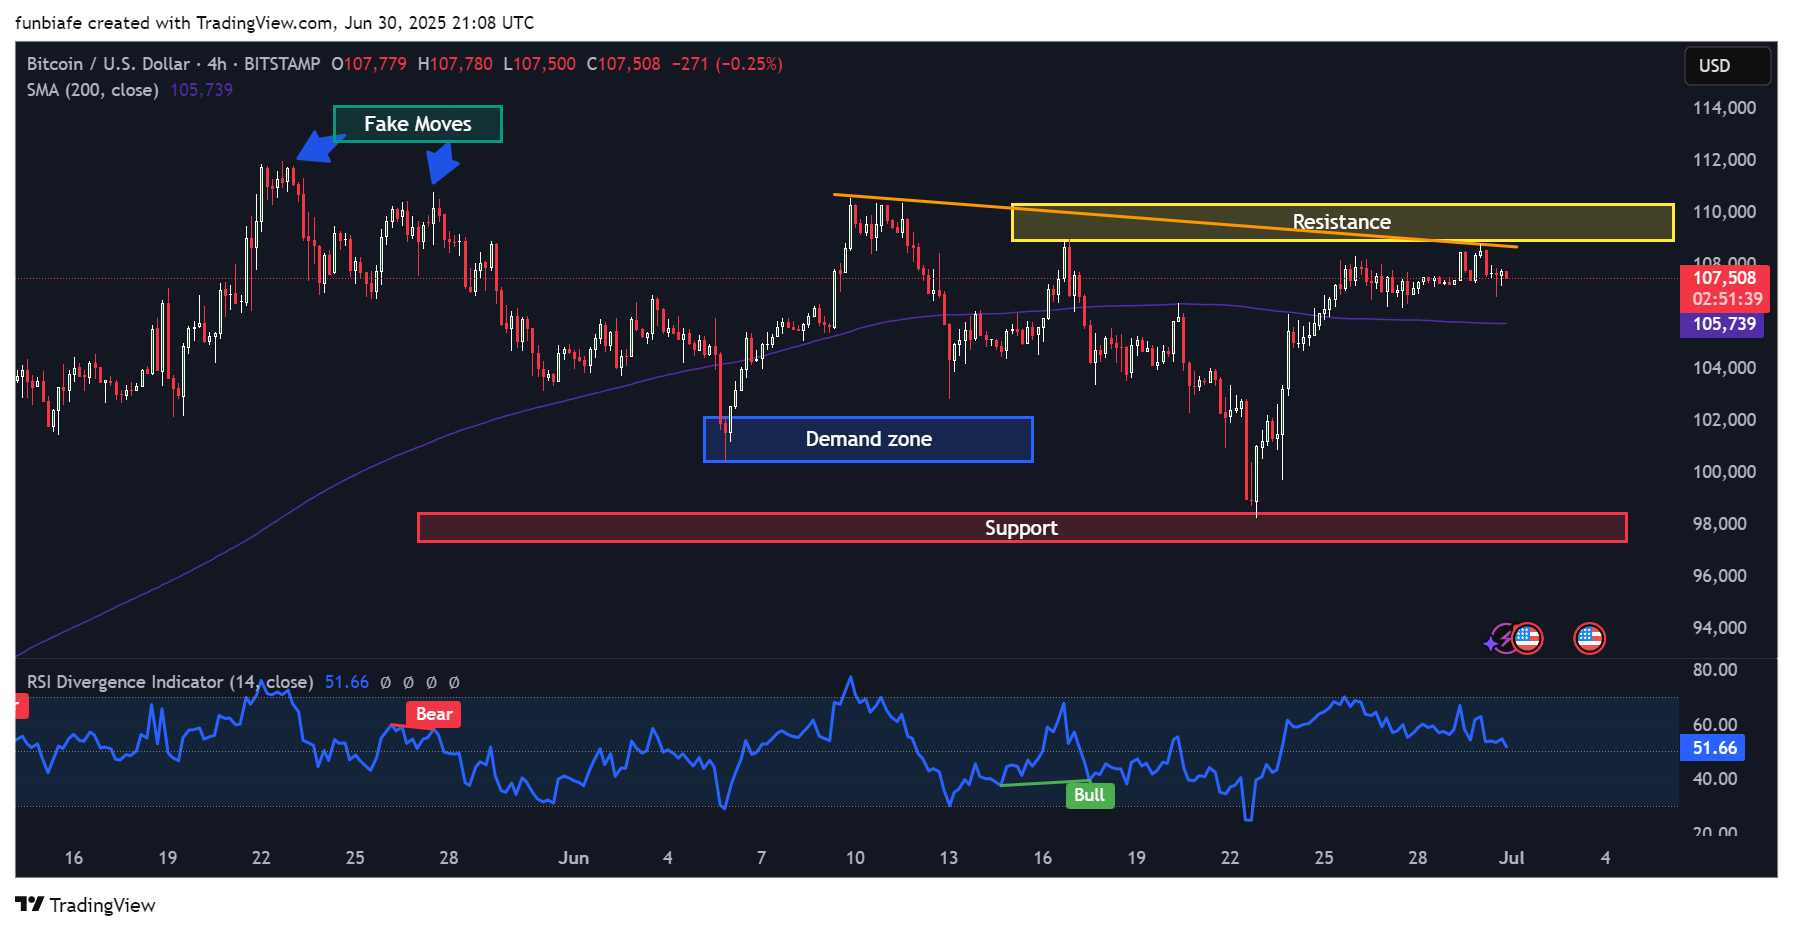
Looking at the 4-hour chart, Bitcoin has traded in a sideways range between $103K and $110K since mid-June.
The yellow resistance zone from $109K to $110.5K has repeatedly rejected significant upward moves, with two fake breakouts around $111K earlier in June that trapped long positions and triggered reversals. Beneath current levels, the blue demand zone between $102,000 and $103,500 has been critical.
This area provided the base for the most recent bounce and aligns with the 200 SMA on the 4H chart, making it a technical floor.
Below that, the red support zone at $97,500–$99,000 marks the last key level that held during the June 13th selloff.
Momentum indicators are currently neutral. The RSI on the 4H chart sits around 51.6, suggesting no clear dominance by bulls or bears.
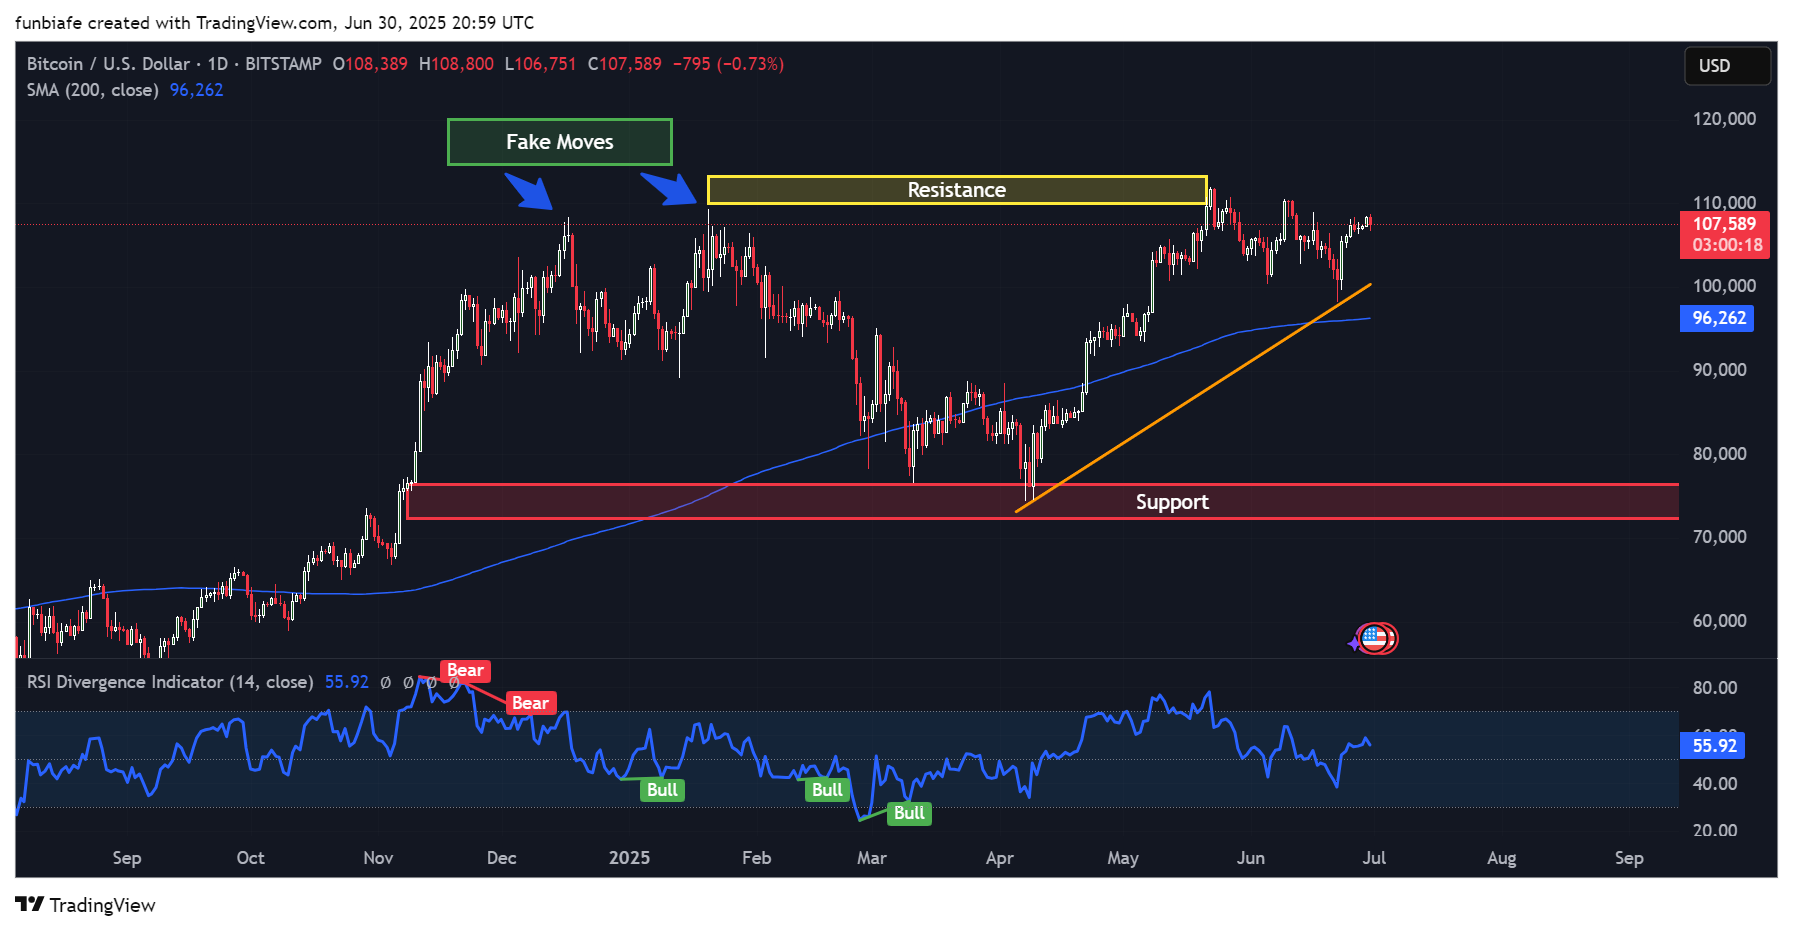
Previous bullish divergences lined up with the mid-June bottom, while a bearish divergence preceded the latest pullback from $110K. The daily chart provides a more zoomed-out picture.
Bitcoin remains within an ascending trendline structure since the March lows, with higher lows still intact. The RSI is also trending upward at 55.9, just below overbought territory.
On-Chain Metrics Paint a Mixed Picture: Institutions In, Retail Out
Data from Crypto Quant shows a sharp rise in active KYC-verified entities starting June 28, right as Bitcoin made a local recovery.
The total number of entities jumped from nearly zero to 19 in a single day, suggesting coordinated institutional inflows or fund reshuffling. Non-KYC entities saw minimal activity, confirming the move was not driven by anonymous wallets or retail.
Combined with a stable UTXO distribution among 10–100 BTC and 100–1K BTC holders, this indicates that the move was supported by “strong hands”, wallets unlikely to sell in short-term volatility.
Meanwhile, retail activity remained flat. Wallets holding between 0.01 and 1 BTC haven’t really been adding to their stacks lately. That fits with the idea that the recent price climb is being fueled more by big players than everyday investors.
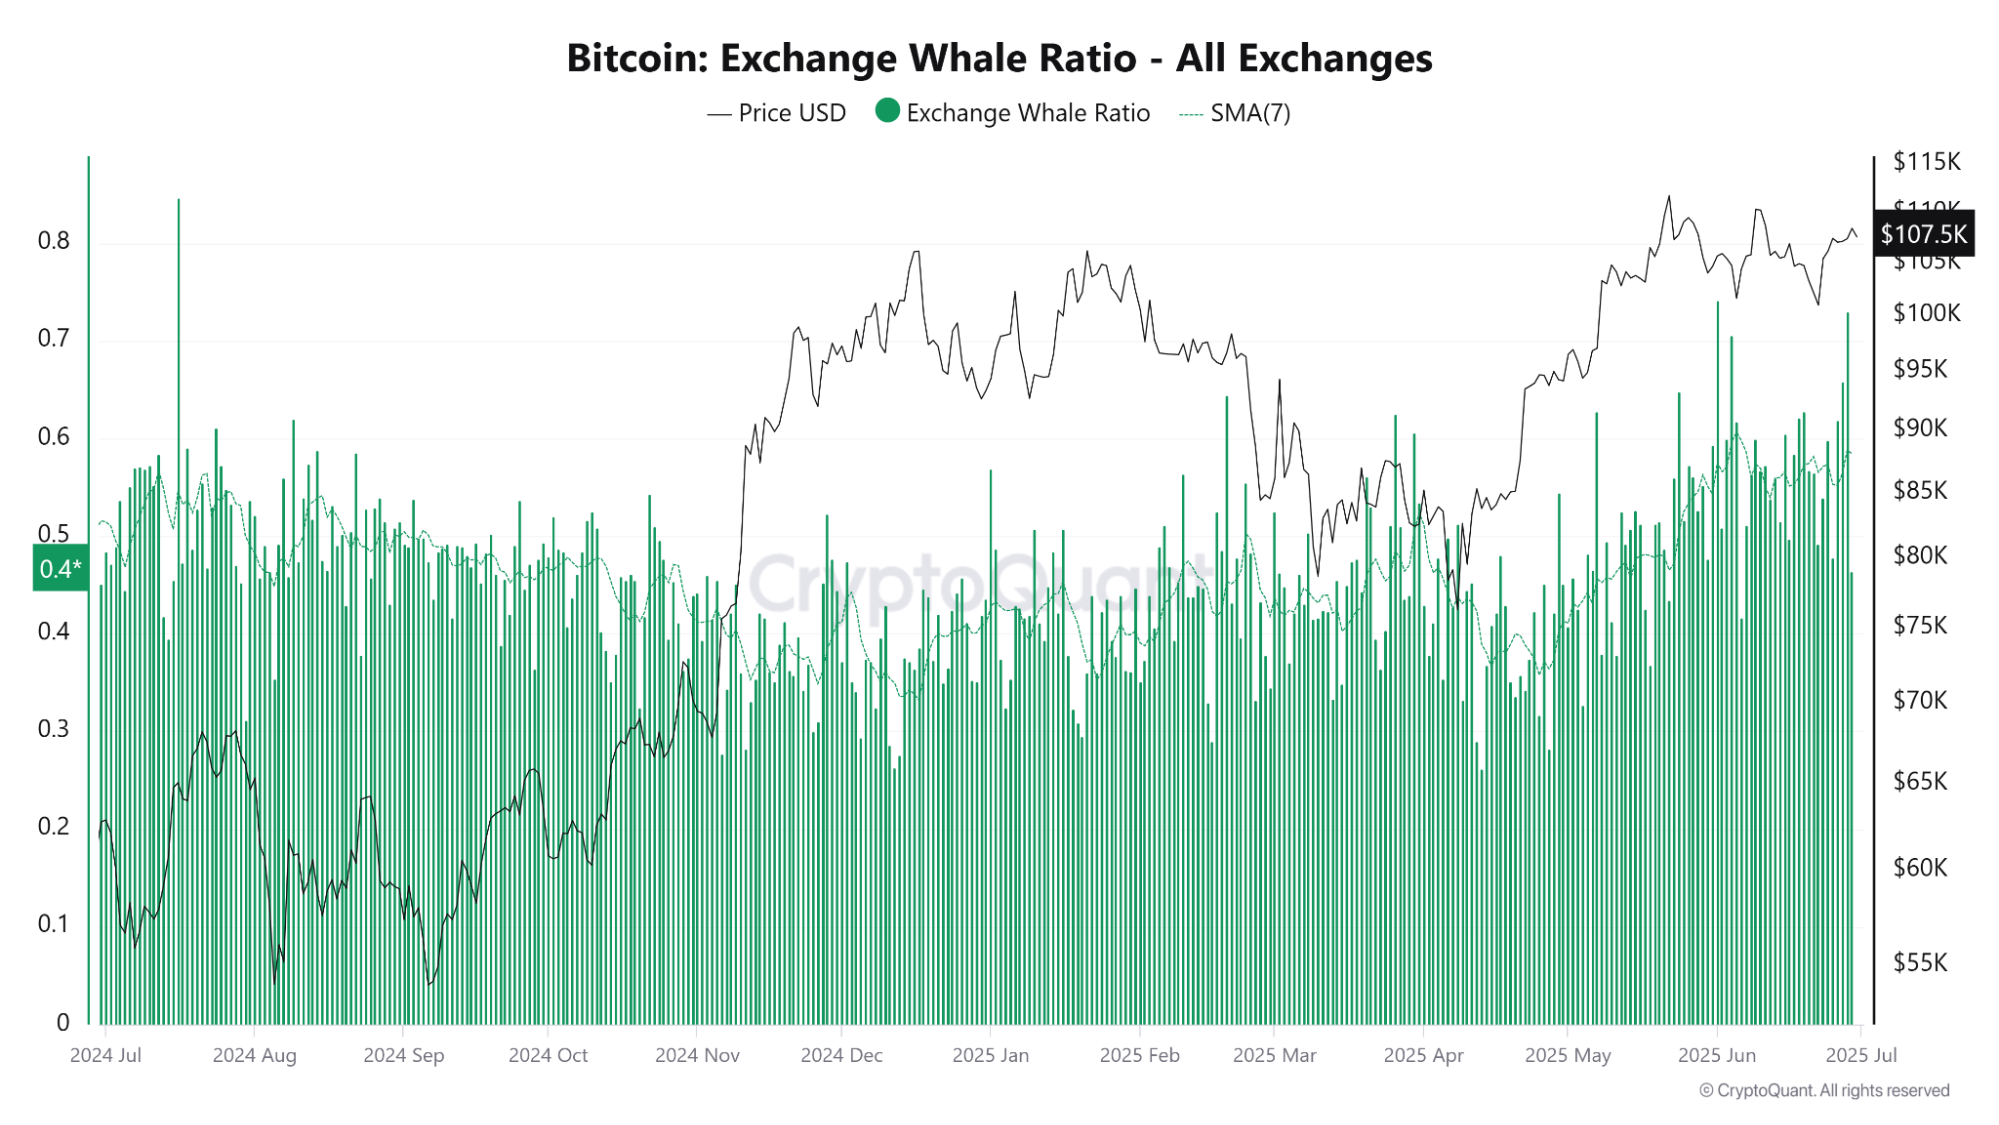
The Exchange Whale Ratio is also beginning to rise again. While it’s still below the danger zone of 0.7, the recent rise from 0.3 to 0.5 hints that some whales might be getting ready to offload or rebalance their portfolios. It’s not a red flag just yet, but it’s definitely something to keep an eye on.
Bitcoin Short-Term Outlook: Neutral to Cautiously Bullish
Bitcoin remains bullish on the higher time frames as long as it trades above the ascending trendline and the 200-day SMA.
However, multiple rejections at $110K make it clear that this resistance must be broken before any new leg up can begin.
If Bitcoin manages to close a daily candle above $111K, the next logical targets would be $115K and $118.2K based on Fibonacci extensions and previous order blocks.
A clean breakout above $111K could unlock a 6.7% upside toward $115,000, with potential for 10% upside if momentum extends to $118K.
If the rejection continues and BTC breaks below $103K, the price is likely to retest the major support area around $98K–$99K.
A loss of this zone opens the door to $95K and possibly the $90K region, which would represent a 10% drop from current levels.
Traders watching the descending triangle pattern forming on the lower time frames should keep a close eye on how the price reacts near $109K–$110K.
A daily close above that would invalidate the pattern and favor a bullish continuation. Otherwise, breakdowns below the $103K line would confirm lower targets ahead.
The stop loss for bullish traders could reasonably be placed just under the $97,500 zone. On the upside, profit-taking zones include $110K, $115K, and $118K, while it depends on confirmation of breakout strength.
eToro: Best platform for beginners and social trading
- Trade cryptocurrencies, stocks, ETFs, and commodities on one easy-to-use platform
- Follow and copy top-performing traders with eToro’s unique social trading tools
- Earn passive income with staking on popular coins like ETH, ADA, and TRX
- Fully regulated in multiple jurisdictions with strong security protocols
- 0% commission on real stock trading and competitive spreads on crypto
- 30+ million registered users across 100+ countries
eToro is a multi-asset investment platform. The value of your investments may go up or down. Your capital is at risk. Don’t invest unless you’re prepared to lose all the money you invest. This is a high-risk investment and you should not expect to be protected if something goes wrong.
Source:: Bitcoin Price Analysis: Resistance Holds At $110K, But Can The $105K Support Survive?