Key highlights:
- Zcash is trading at $965, down 43% from its Sep 26 peak of $1,680.
- The biggest privacy coin has lost 26% of its value in the last seven days, performing significantly worse than Bitcoin (-8%) and Ethereum (-15%)
- The drop came despite the NU7 upgrade activating on Nov 7 and growing activity: Grayscale launched Zcash Invest, and ZCSH’s share count rose 54.2% since listing
- Zcash technicals are bearish: RSI below 40, with the 10-day and 20-day EMAs giving sell signals.
- Downside targets are ~$800 and $742–$749, while a recovery would require reclaiming $1,100
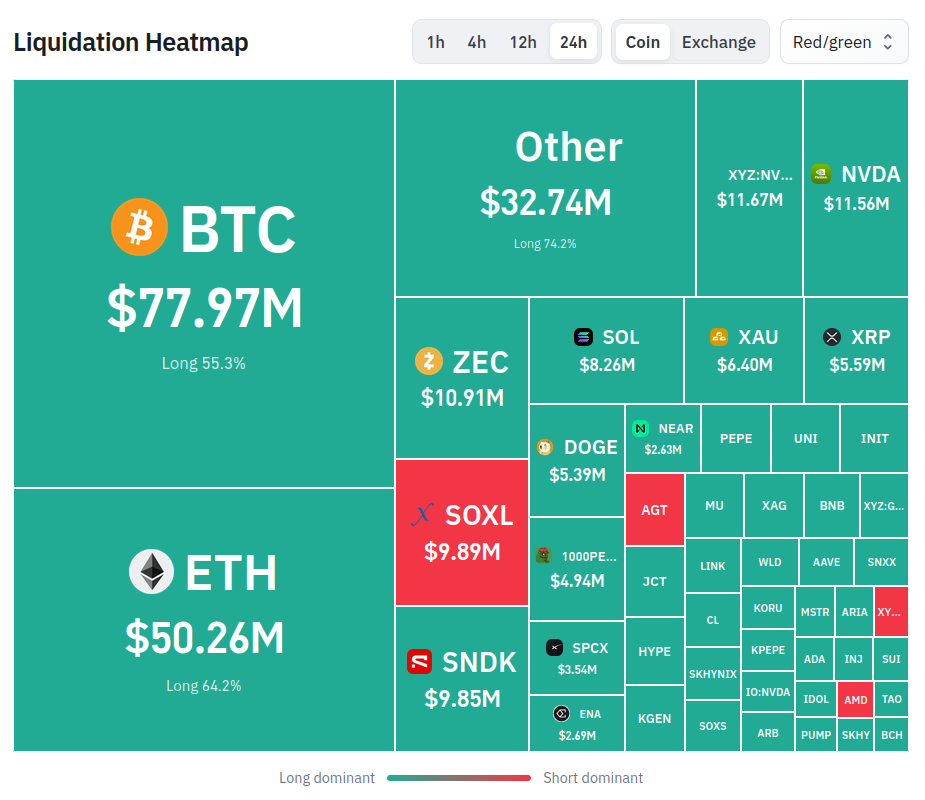
Forced closures of leveraged long positions can intensify selling because exchanges liquidate traders whose positions no longer meet margin requirements.
With ZEC losing the psychologically important $1,000 level, liquidations added another source of selling pressure.
Zcash continued to weaken despite its recent NU7 upgrade, which cut target block times from 75 seconds to 25 seconds. The upgrade speeds up transaction confirmations and raises capacity in the newest shielded pools from 2.9 to 6.6 transactions per second.
Developers are also considering 20-second blocks, while proposed NU8 features include four-times-larger blocks and post-quantum protections.
Institutional activity has continued despite Zcash’s market weakness.
Grayscale Investments launched Zcash Invest, a platform aimed at educating investors about the Zcash ecosystem and its exchange-traded product, ZCSH.
The asset manager also plans to donate $1 million to organizations supporting Zcash development, financial privacy, and adoption.
ZCSH’s share count rose 54.2% between its August 25 listing and October 30, while assets reached about $773 million on October 29.
Meanwhile, Zcash treasury company Cypherpunk Technologies mined 5,944 ZEC in September, roughly 14% of the monthly issuance.
However, these developments have yet to reverse the market’s short-term direction.
Zcash recovery faces resistance as bearish signals emerge on the charts
Technical indicators also point to weakening momentum as the daily Relative Strength Index has fallen below 40, suggesting sellers currently have greater control.
The 10-day and 20-day exponential moving averages, at approximately $1,135 and $995, respectively, are both generating sell signals.
However, longer-term averages, including the 50-day and 200-day EMAs, remain below the current price and still indicate a broader bullish structure.
Source: BushiTrades via TradingView
Traders are watching the $800 region as the next potential downside area. One technical projection places the target around $807, close to the 200-day exponential moving average.
Another four-hour chart analysis identifies support between $742 and $749 if selling continues.
A move back above $1,100 would provide an initial sign of recovery, while resistance between $1,317 and $1,391 remains a major obstacle for buyers.
A sustained breakout above $1,391 could reopen the path toward September’s highs near $1,705.
Source:: Zcash Price Is Down 43% from Its September Peak, Why Is ZEC Still Falling?