Key highlights:
- LINK is consolidating near $8.40, with the $8.40-$8.65 zone acting as the key breakout level
- Active addresses and transfers have declined sharply, creating a bearish divergence against a relatively stable LINK price
- DTCC’s planned Q4 2026 launch and continued whale accumulation are supporting the longer-term bullish outlook for Chainlink
Chainlink is back at a level that has traders paying close attention. The LINK price is trading around $8.40, and one trendline is doing most of the heavy lifting in the current debate. Crypto analyst CW says the key support line is still intact, and as long as that line holds, the broader bullish structure remains alive.
That sounds straightforward, but the setup is actually pretty mixed. The chart is showing tight consolidation, on-chain activity has been cooling, and institutional adoption keeps expanding through major financial infrastructure projects. The next few weeks may tell us which of those stories matters most.
The LINK price is stuck in a tight range
We had a look at the chart CW shared and the first characteristic feature to be noted is that the price action has been squeezed significantly. On the chart, Chainlink has been fluctuating within the range of $8.00-$8.90, with the current price of about $8.325.
The key support line for $LINK remains unbroken.
As long as this line is not broken, the bullish trend continues. pic.twitter.com/Xt8wEZfBBp
— CW (@CW8900) July 28, 2026
The point of control, which is the level at which the majority of the last trading volume has been recorded, is located at about $8.335. The lower edge of the value area is near $8.233, and the upper edge is around $8.672.
That usually points to indecision rather than a strong trend. The chart still labels the anchor trend as bullish, but selling activity has been slightly stronger than buying activity at current levels.
A figure that warrants mention here is the ADX at around 40. When an ADX goes above 25, it indicates a good trending condition, meaning that breaking out of this condition may be more powerful than expected.
The LINK bigger trend is still under pressure
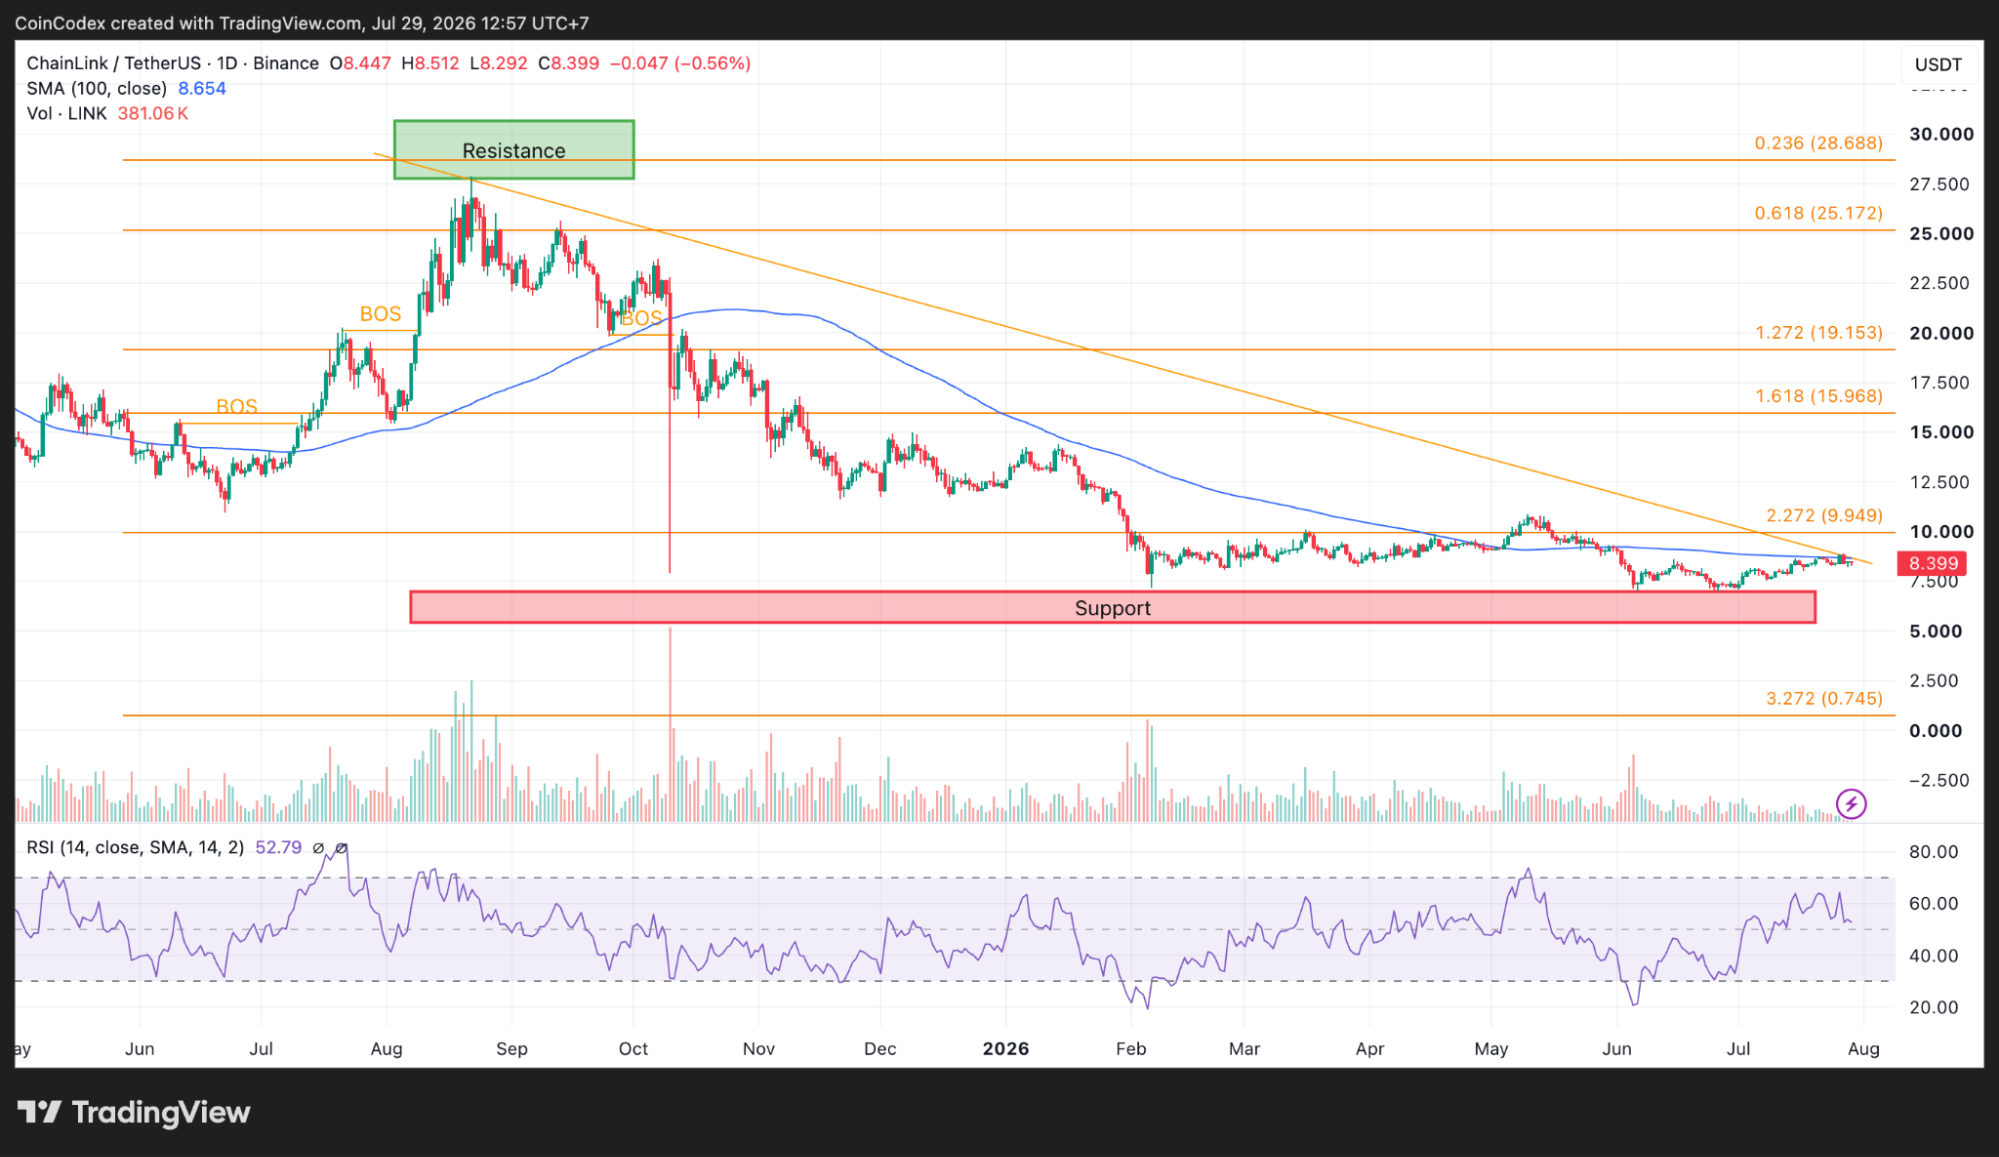
The daily chart indicates a significant move down from the late-2025 high of $28.69 to the current price of $8.40. This is a fall of about 71%. The silver lining here is the fact that the LINK price is now only 2.9% away from its 100-day moving average of $8.654.
Daily LINK chart analysis
At the start of the year, this difference was larger. The moving average has now started forming a horizontal pattern after months of declines. This is usually the first sign that the bearish momentum is losing steam. On the daily chart, the RSI is at 52.8, above the neutral 50 level, and has been forming higher lows despite lower lows in the price action.
This sort of bullish divergence is common when approaching bottoming points. The setup for the shorter time frame is more compressed. The 4-hour chart sees the LINK price almost directly on the 100-period moving average near $8.40. The current price is just a few cents below this point.
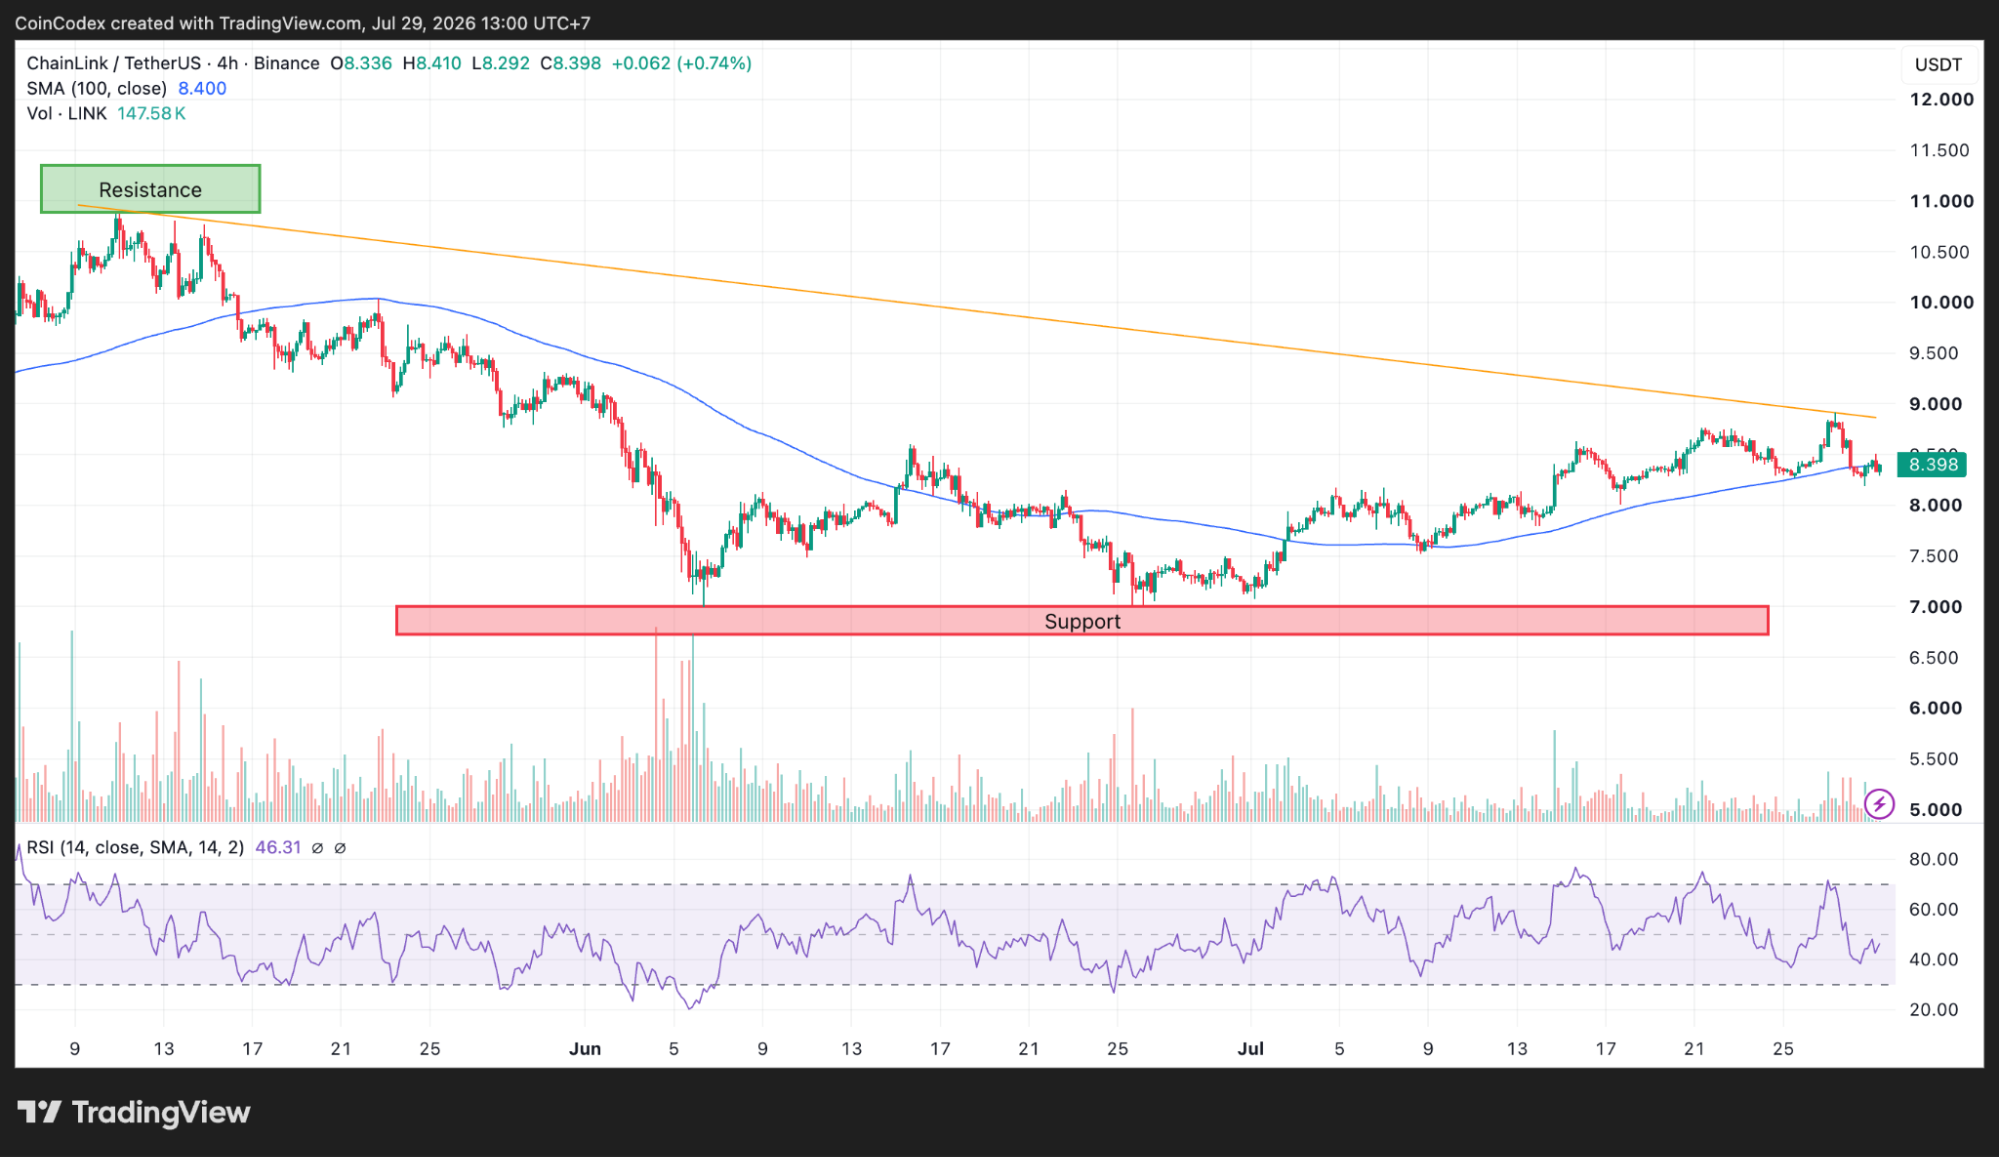
4-hour LINK chart analysis
The RSI on this timeframe is around 46.3, slightly below neutral, which tells us short-term momentum is still weak. Buyers have not taken control, but sellers have not been able to push the market decisively lower either.
If LINK can break above $8.40 with convincing volume, traders will likely start watching $8.50 and then $9.00. If price gets rejected there, the market could revisit $8.29 and then the important $8.00 support area.
The on-chain data is not as encouraging
This is where things get interesting. Chainlink’s network activity has been moving in the opposite direction. Daily active addresses have decreased from approximately 4,200 to 2,600, which is a decrease of about 38%.
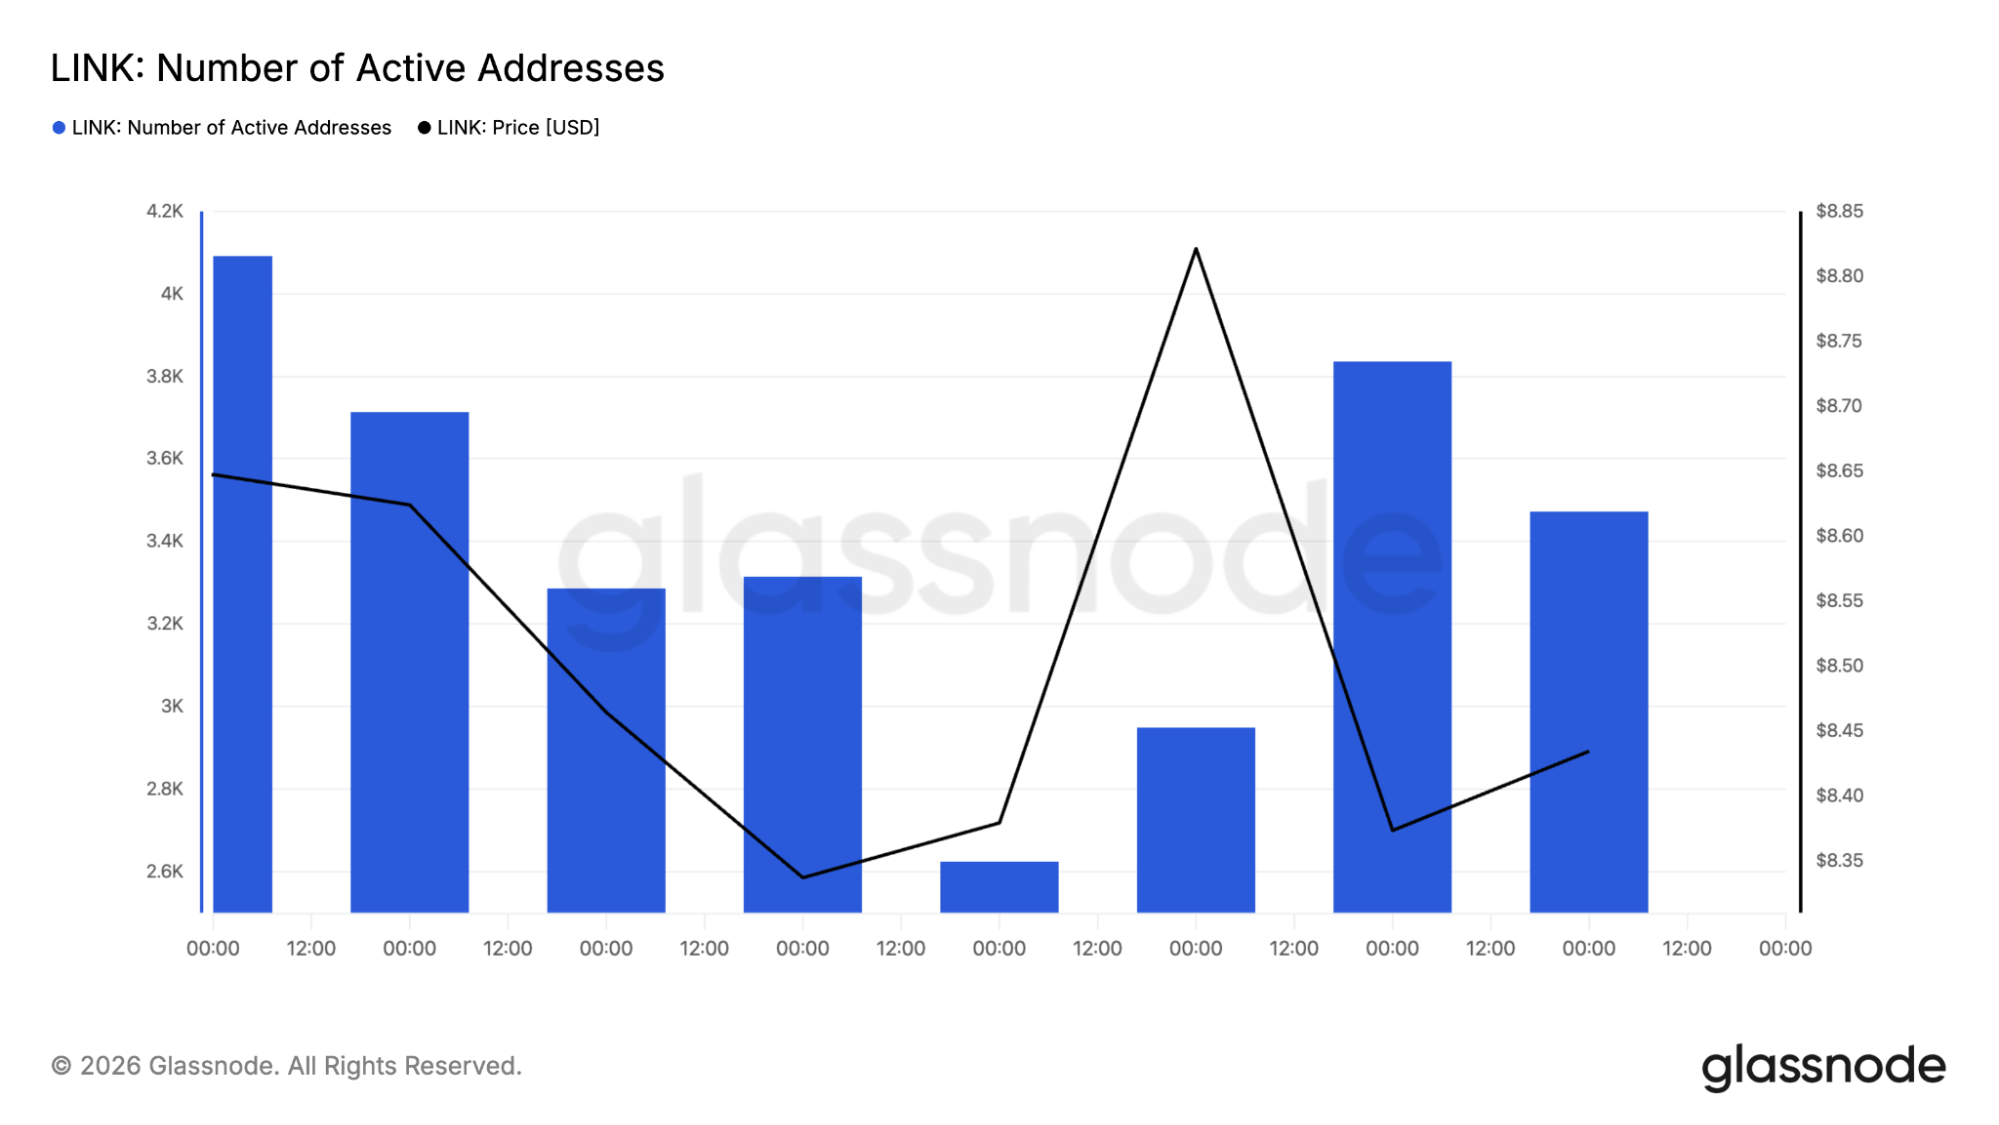
The number of transfers per day has reduced from approximately 9,500 to 4,000, which is an almost 58% reduction. What is peculiar here is the stable price for LINK tokens at $8.00-$8.50 during this period.
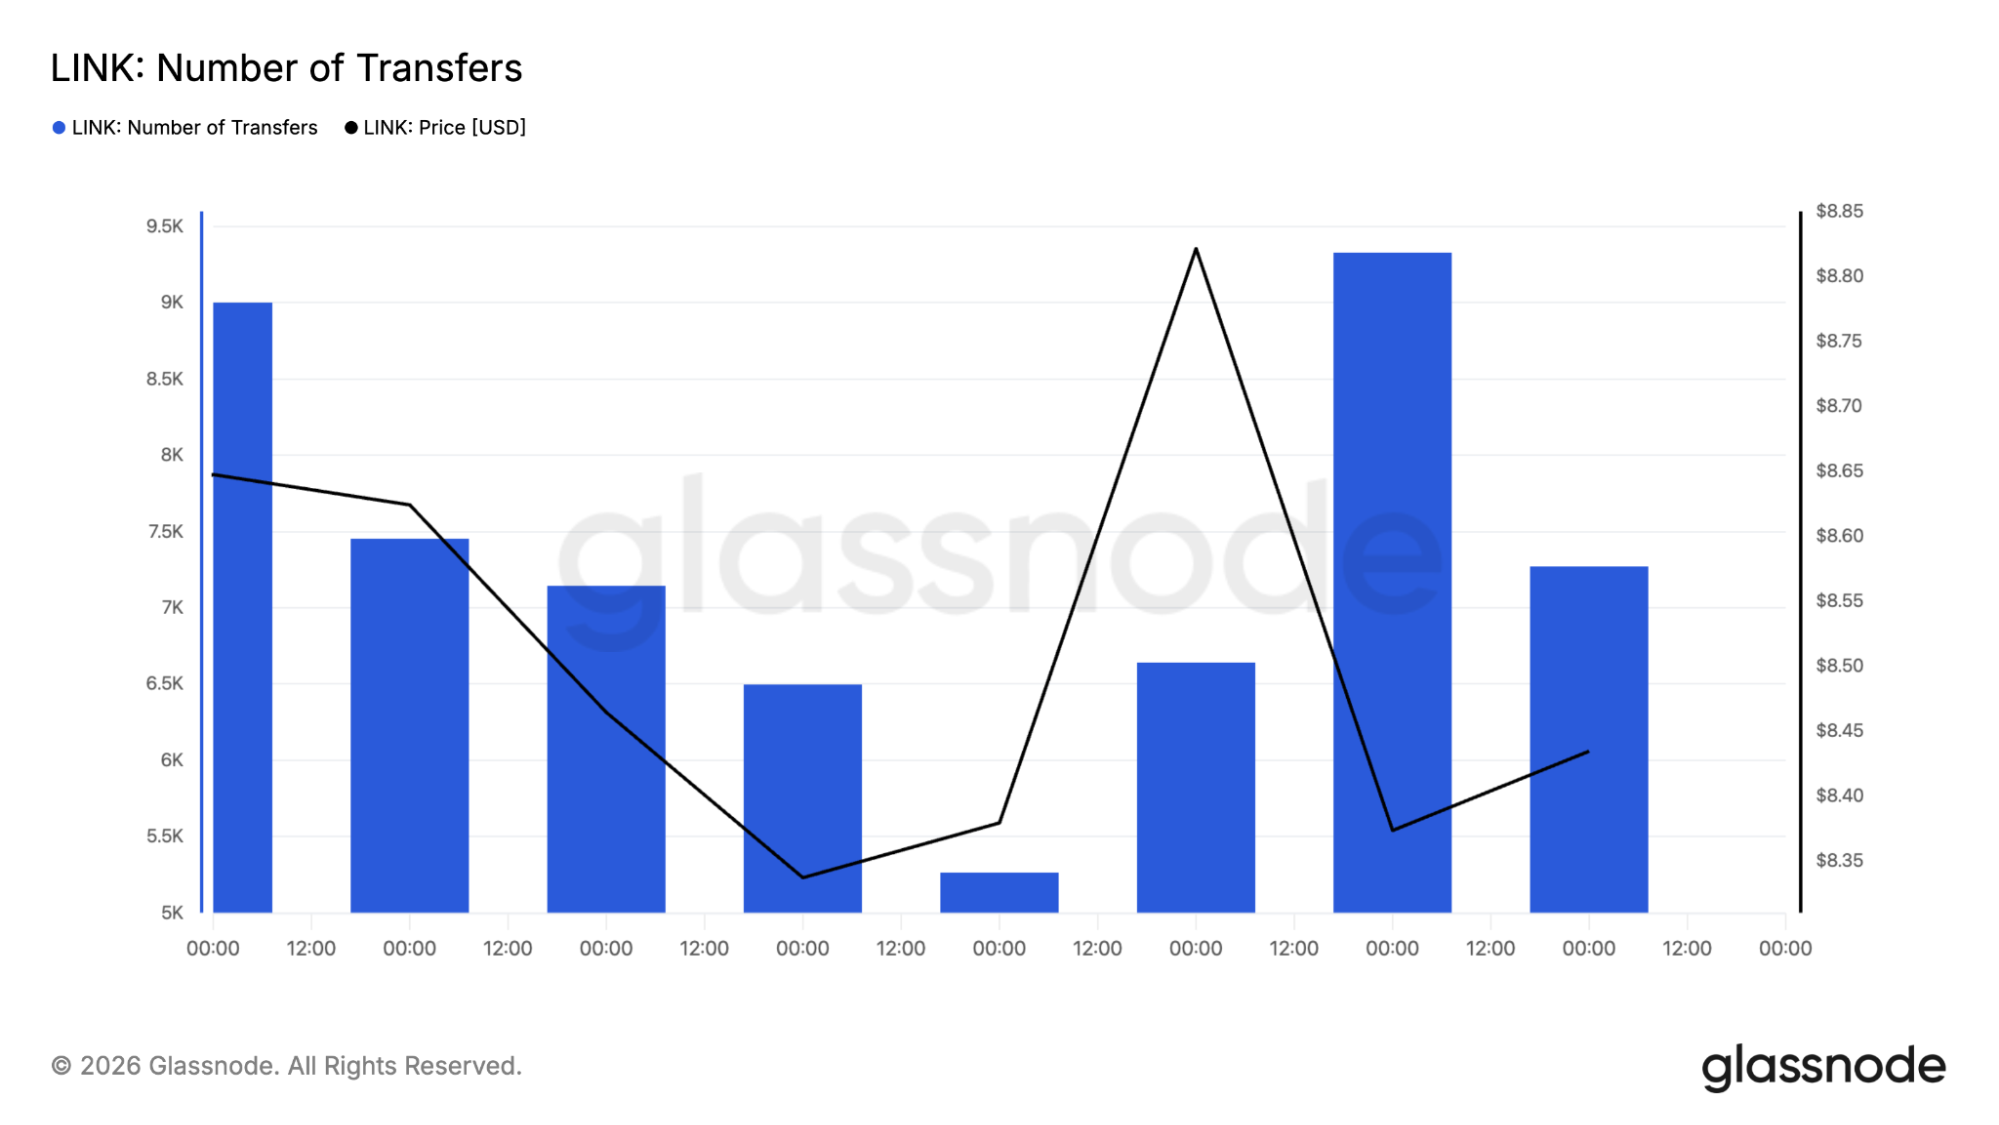
When price remains flat but usage falls sharply, traders often view it as a bearish divergence because the market is not being supported by expanding network activity.
Institutions are still pushing into Chainlink and whales keep buying
The strongest bullish argument is not coming from retail activity right now. It is coming from traditional finance. The DTCC, which processed about $4.7 quadrillion in securities transactions during 2025, plans to launch its Collateral AppChain using Chainlink’s Runtime Environment in the fourth quarter of 2026.
Chainlink has also been integrated with Swift and other financial infrastructure providers. If those systems generate meaningful production usage, demand for LINK could become tied more directly to institutional settlement activity, staking, and oracle services instead of retail speculation alone.
One bullish signal that keeps coming up is whale behavior. Large holders have accumulated more than 14 million LINK in recent weeks, and exchange reserves have continued falling. Lower exchange balances usually mean fewer coins are available for immediate sale.
Historically, the process of buildup during consolidation periods has tended to precede significant moves in price due to the absorption of all available liquidity in the market. While this is no assurance of a rally, it minimizes any imminent pressure to sell.
So what happens to LINK next?
The roadmap is fairly clear. The first hurdle is $8.40. Above that, traders will focus on $8.50, then the daily moving average near $8.654, and eventually the larger $9-$10 resistance zone.
On the downside, $8.29 is the first support, followed by $8.00 and then $7.50. The bigger battle is between weakening on-chain activity and expanding institutional adoption. Right now, the LINK price is sitting almost exactly where those two narratives meet.
The chart says a breakout is close, the network data says caution is warranted, and the institutional story says Chainlink may still be in the early stages of a much larger infrastructure role. The next decisive move above or below the $8.40-$8.65 region will probably set the tone for the rest of the quarter.
According to CoinCodex’s 1-month LINK price forecast, the LINK price is projected to reach $9.88, indicating moderate upside potential from current levels if buyers can reclaim the $8.65-$9.00 resistance zone.