Key highlights:
- Bitcoin exchange-to-exchange flows have dropped 91%, easing from 1,800 BTC to 166 BTC as European exchange migration slows
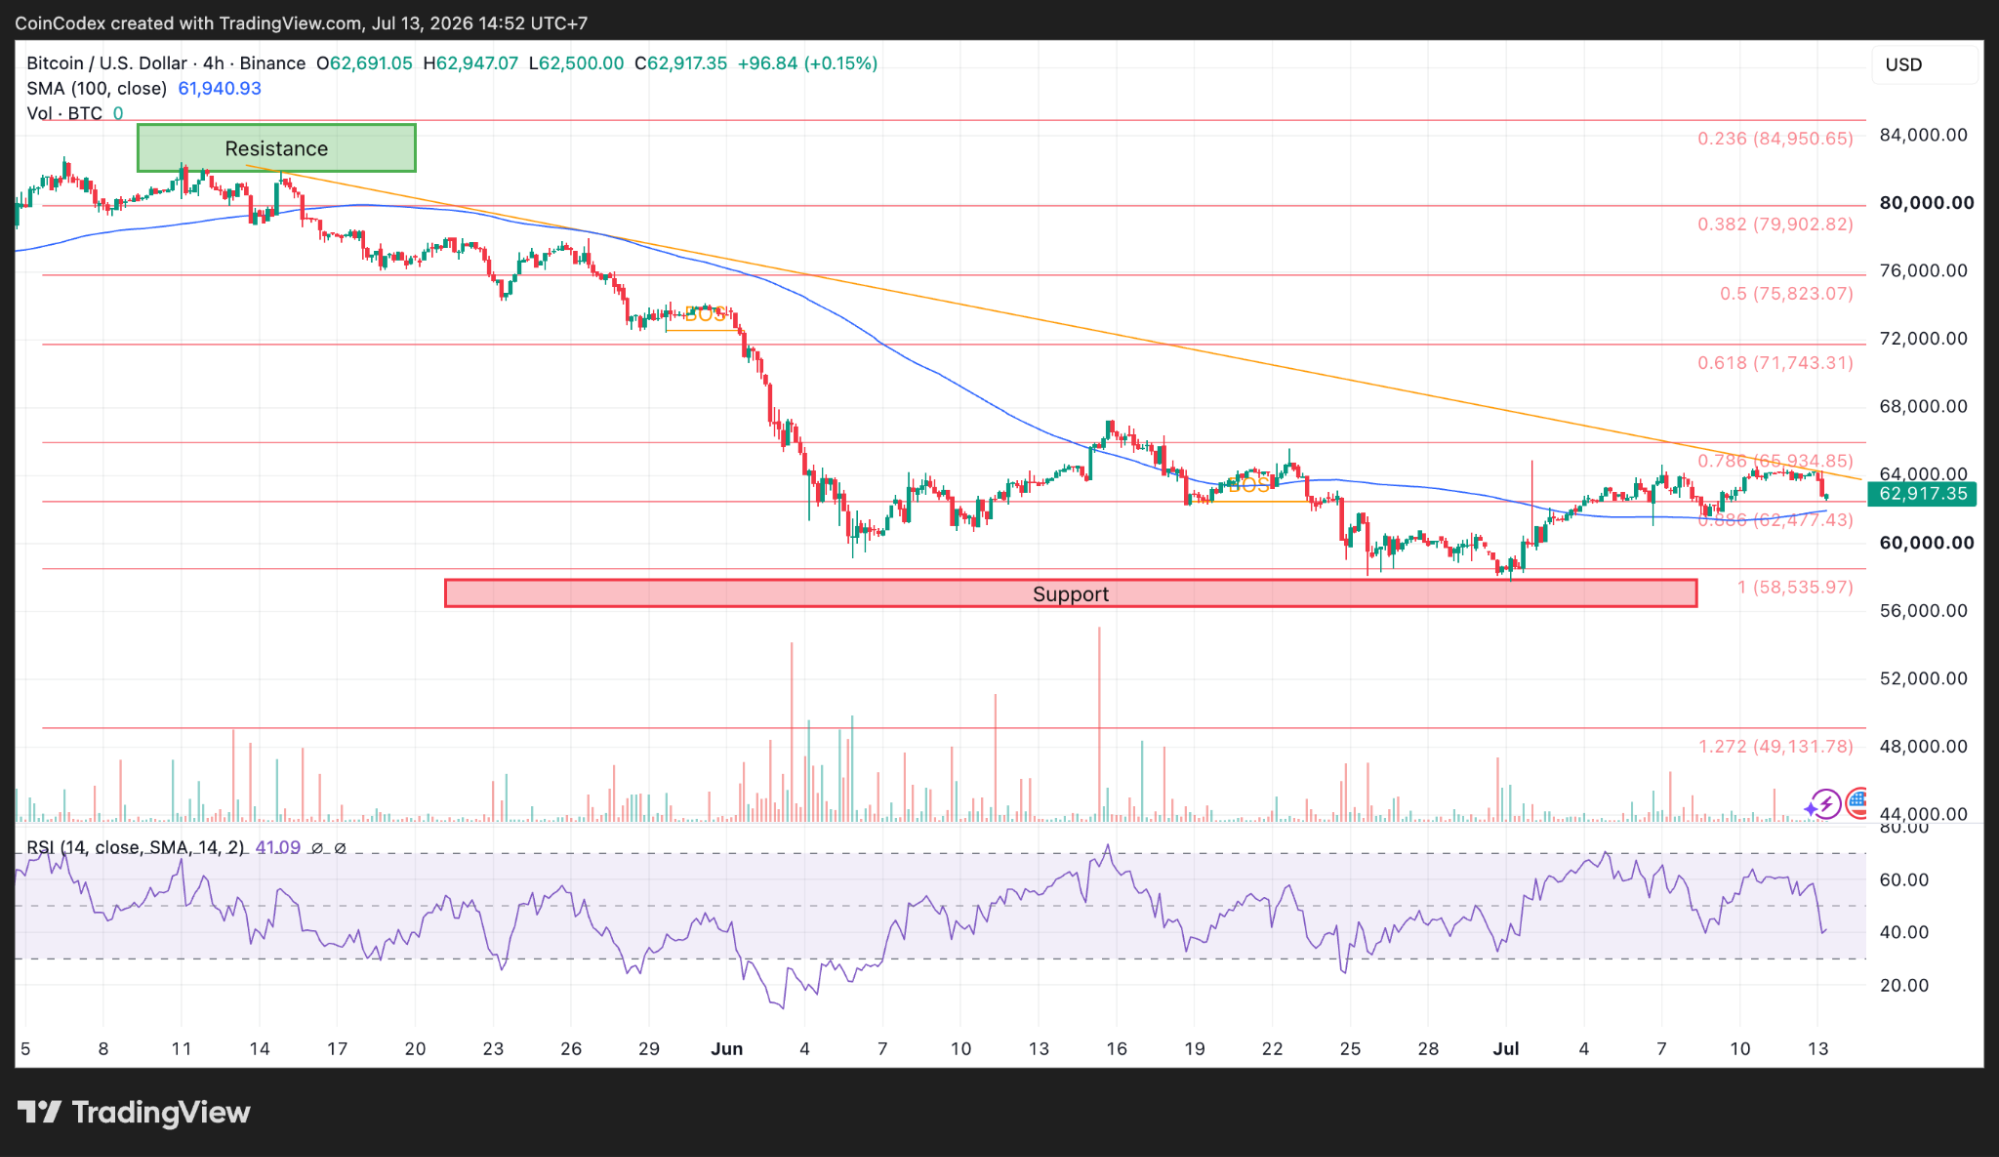
- BTC is still trading above the 4-hour 100-period SMA level, with $63,500 and $64,000 being the next resistance levels on the cards
- Spot US Bitcoin ETFs managed to end the streak of outflows in eight weeks by recording close to $200 million in net inflows
tells us a different story compared to the price. The daily active Bitcoin addresses have been within the range of around 640,000 to 660,000 during the period analyzed, while the price of BTC dropped from $53,800 to $52,200.
This is very important because it indicates that people are actively using the network despite the lack of bullish price behavior. During strong bull market periods, Bitcoin has registered daily active addresses within the range of 800,000 to 1,000,000.
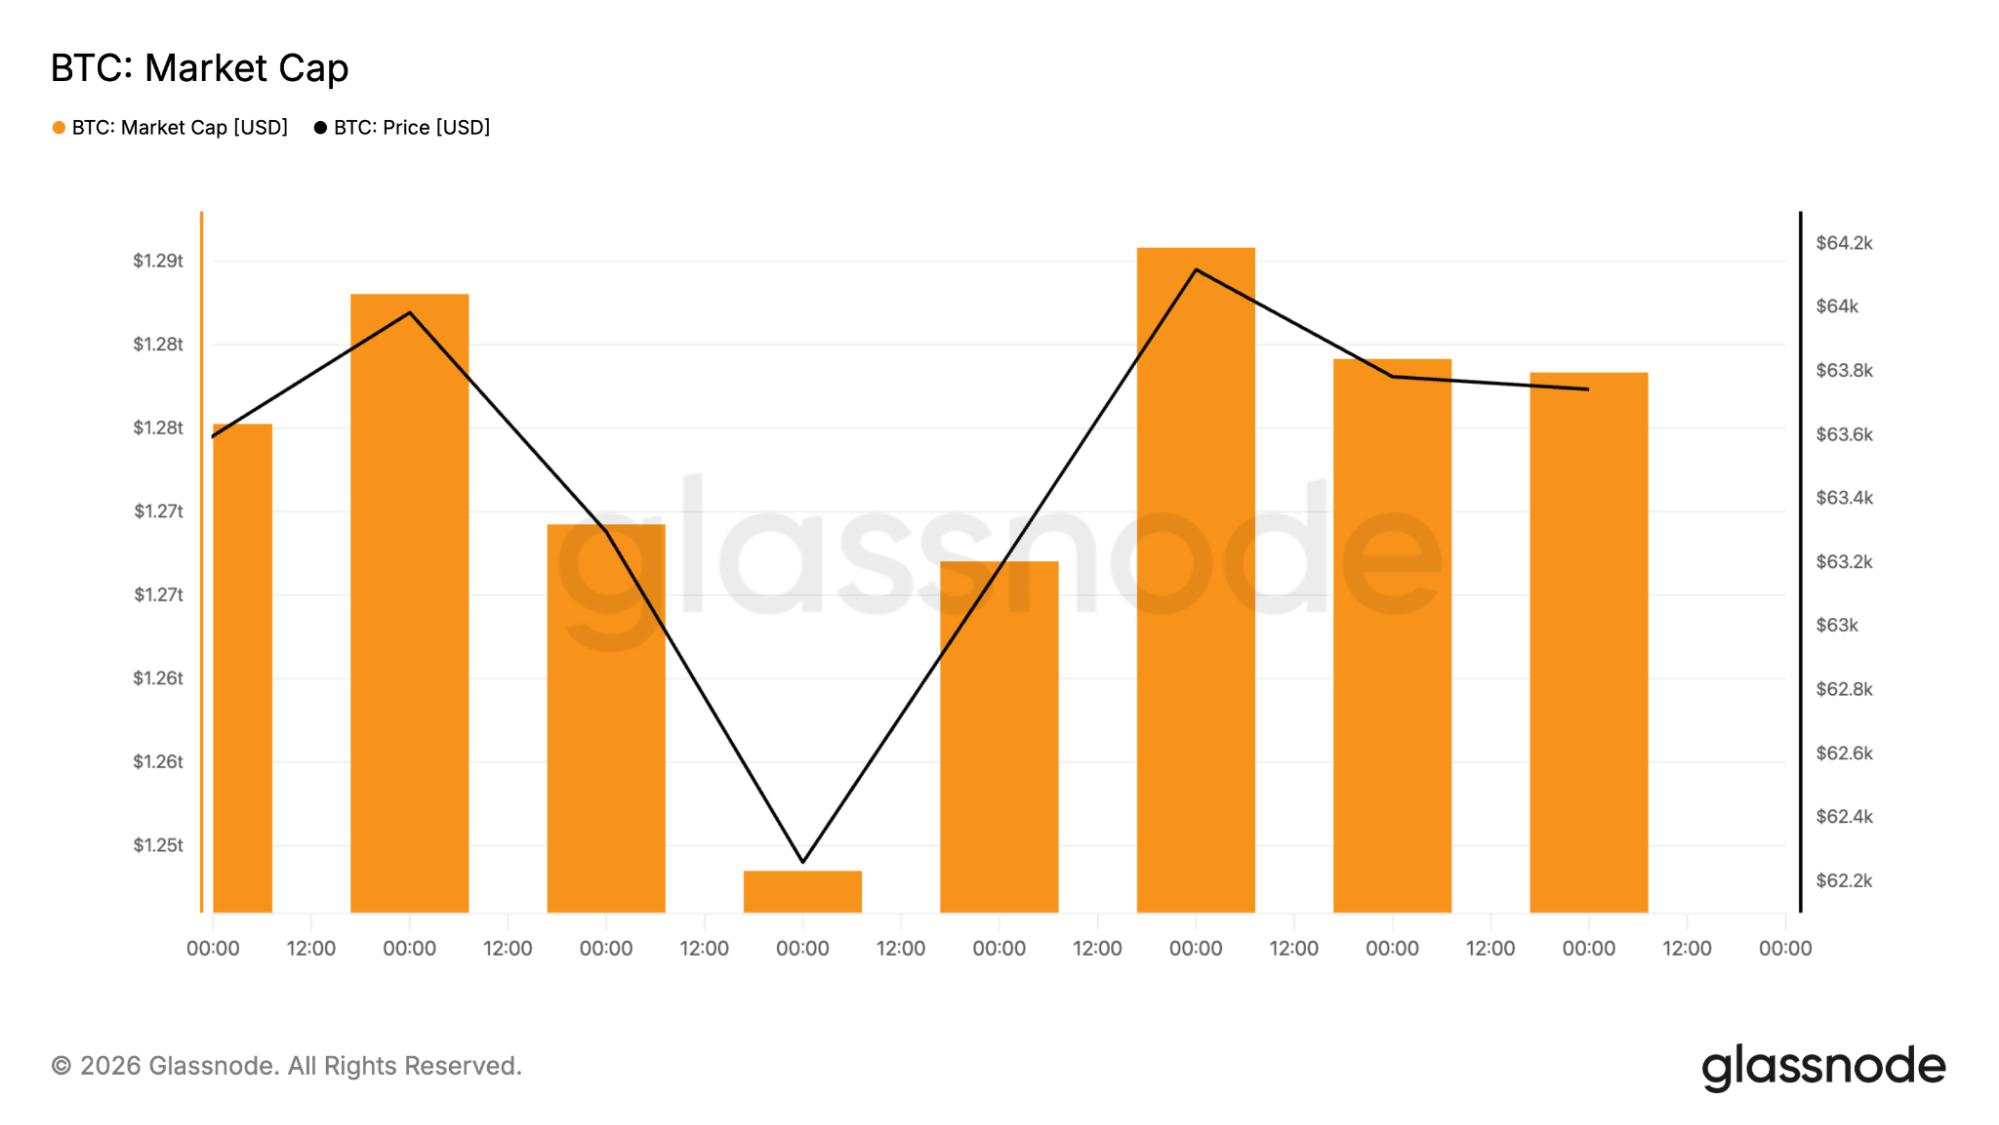
The present range falls below those levels, but it remains comfortably above the lows typically associated with weaker network participation. BTC Market capitalization also recovered after falling toward $1.245 trillion. It has since returned to roughly $1.28 trillion, matching the improvement in price and pointing to fresh capital returning after June’s weakness.
Bitcoin ETF investors are buying again
Institutional flows have also improved after months of selling. Net outflows in US listed Bitcoin ETFs continued for eight consecutive weeks in a row, with around $8 billion flowing out of such products from mid-May to early July.
The overall assets under management of the ETFs fell from around $102.6 billion to about $78 billion. But last week marked an end to the trend, with almost $200 million flowing into them. That doesn’t erase the previous withdrawals, but it does mark the first positive week in nearly two months.
Much of the buying came through BlackRock’s IBIT, although traders will be watching closely to see whether inflows begin spreading across more ETF issuers over the coming weeks. If inflows continue, ETF demand could become another source of support for the BTC price.
What comes next for the BTC price?
Bitcoin has several encouraging developments working in its favor. Exchange-to-exchange flows have normalized after the European migration between exchanges, active addresses remain stable, market capitalization has recovered from June’s lows, and ETF investors have finally returned after eight weeks of persistent selling.
Nevertheless, it is clear from the graphs that much work needs to be done. As long as the price of BTC stays above the 4-hour moving average of $61,940, buyers will maintain short-term dominance.
A break above $62,947 will open up the levels of $63,500 and $64,000, while $64,308 would be the next resistance point. However, the more difficult task is to close above the daily 100-day moving average of $70,695. Until Bitcoin closes above that level, the broader trend has yet to fully improve.
CoinCodex’s 1-month BTC price prediction places the price at $66,354, pointing to modest upside from current levels if buyers can defend support around $61,940 and reclaim the $63,500-$64,000 resistance zone.
Source:: Bitcoin Price Prediction: BTC Eyes Higher Levels as ETF Inflows Return and Exchange Flows Ease