Key highlights:
XRP has been under pressure over the last few months, prompting speculation from many investors about how close we might be to the end of this correction. One of the analysts who is hopeful about the current state of XRP is Celal Kucuker, as he says the XRP price will soon hit one of the critical support levels on its chart.
According to his long-term forecast, the bottom is at around $0.86-$0.87, with a possible rise to $8-$9 if the trend that has been active for more than ten years will continue to be respected by XRP.
This level seems quite distant at the moment, while the technical picture doesn’t look bullish yet, with both 4-hour and daily charts reflecting pressure in the market. However, there’s still plenty of developments going on in the space of XRP.
The long-term XRP chart still favors the bulls
We had a closer look at Celal Kucuker’s weekly chart and it does not take much to notice one particular characteristic. XRP has been trading within the long-term ascending channel since 2014.
The bottom of the mentioned channel coincides with 0.618 Fibonacci retracement level at $0.8781; thus, this area can be considered as one of the strongest levels of support that can be seen on the chart.
I’ve shared this chart before.
I still think it’s one of the best scenarios for $XRP.
In my view, the bottom is around $0.86–$0.87, while the top target is about 10x higher, in the $8–$9 range.
This chart aligns well with the $54K Bitcoin scenario. pic.twitter.com/CcofYKnRH9
— Celal Kucuker (@CelalKucuker) June 25, 2026
It is worth noting that previous market cycles followed a similar pattern when XRP supported within the channel to proceed with its next rise. If such a situation persists in the future, the chart indicates reaching the 1.618 Fibonacci extension level at $9.04; this would mean an almost tenfold increase from the support area near $0.87.
The chart also places the next major cycle peak somewhere between late 2026 and early 2027, although plenty needs to happen before XRP gets anywhere near those levels. A weekly close below the lower boundary of the channel would invalidate this long-term setup and force traders to reassess the entire bullish outlook.
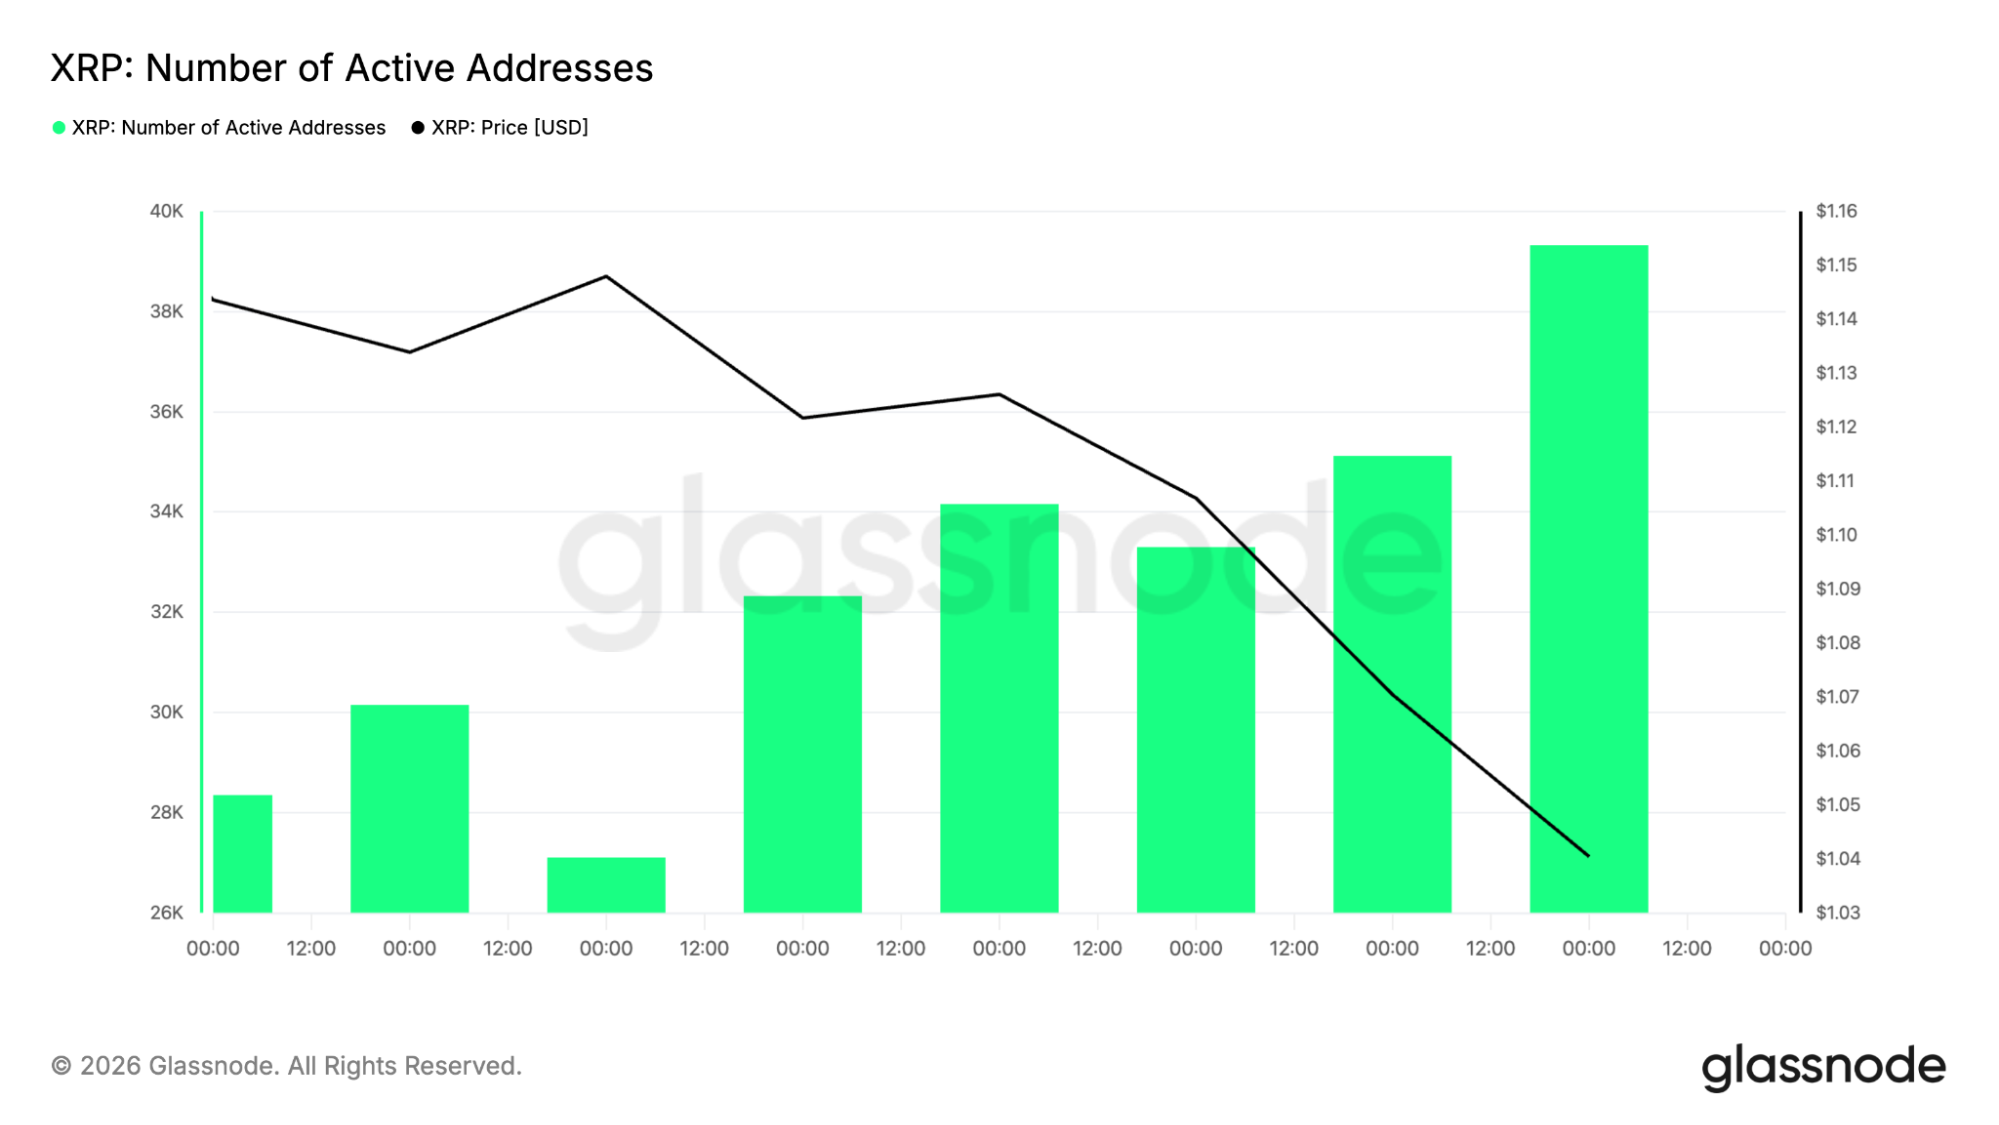
Network activity keeps growing despite the XRP price weakness
The XRP price may still be under pressure, but activity on the XRP Ledger is moving in the opposite direction. We had a look at the latest on-chain data, and daily active addresses climbed from about 26,000 to nearly 40,000 during the measured period.
That’s an increase of roughly 54%, showing that more wallets are interacting with the network. Transaction activity has also picked up. Daily transfers rose from around 300,000 to approximately 520,000, marking a 73% increase over the same timeframe.
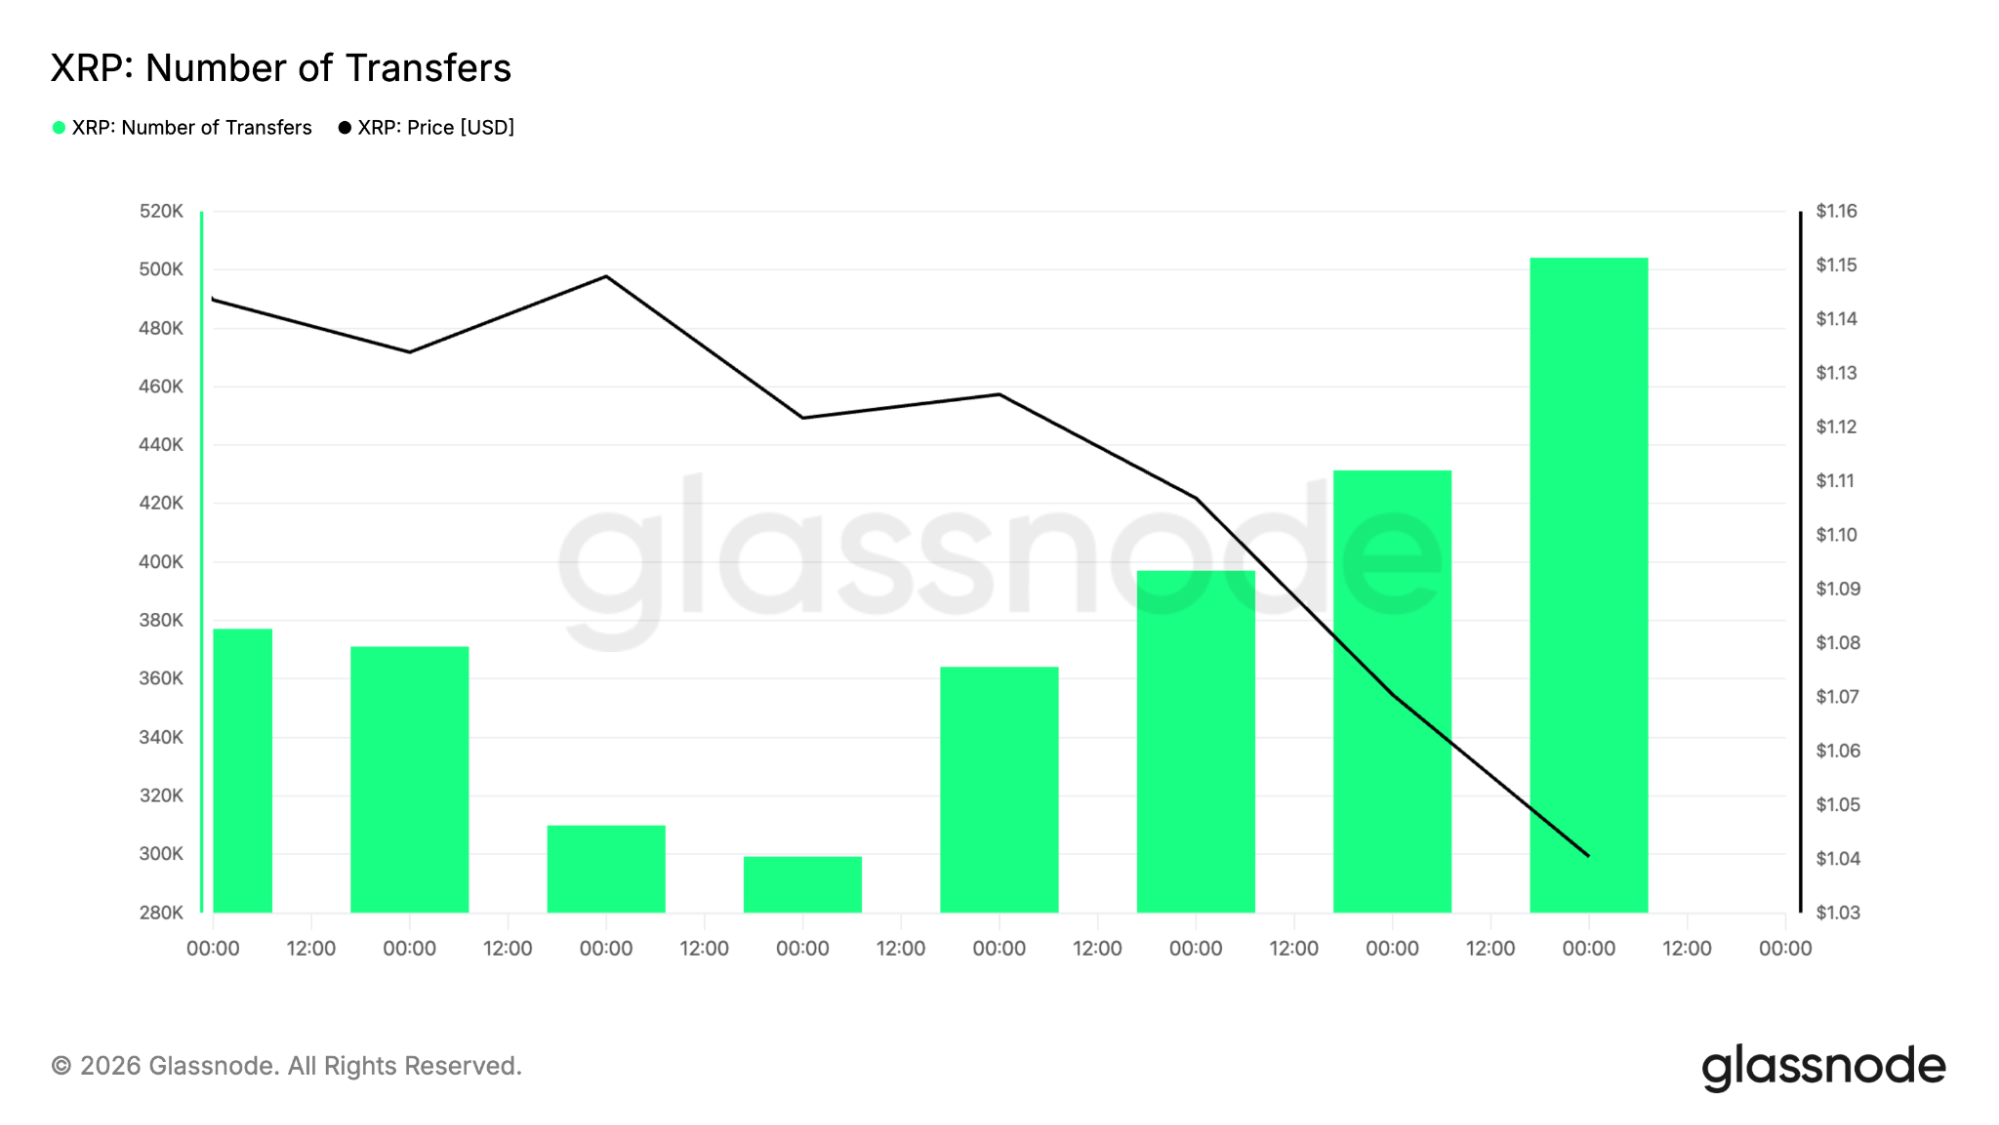
During that period, the XRP price also moved from roughly $1.04 to about $1.14 before the broader market correction pulled prices lower again. XRP still trails larger blockchain networks like Bitcoin, Ethereum, and Solana in total active addresses. Even so, the steady rise in wallet activity and transaction volume points to growing network usage.
XRP short-term charts are still under pressure
The long-term picture looks encouraging, but the shorter timeframes continue telling a different story. We had a look at the 4-hour XRP chart, where the XRP price trades around $1.037, roughly 9% below the 100-period SMA at $1.14.
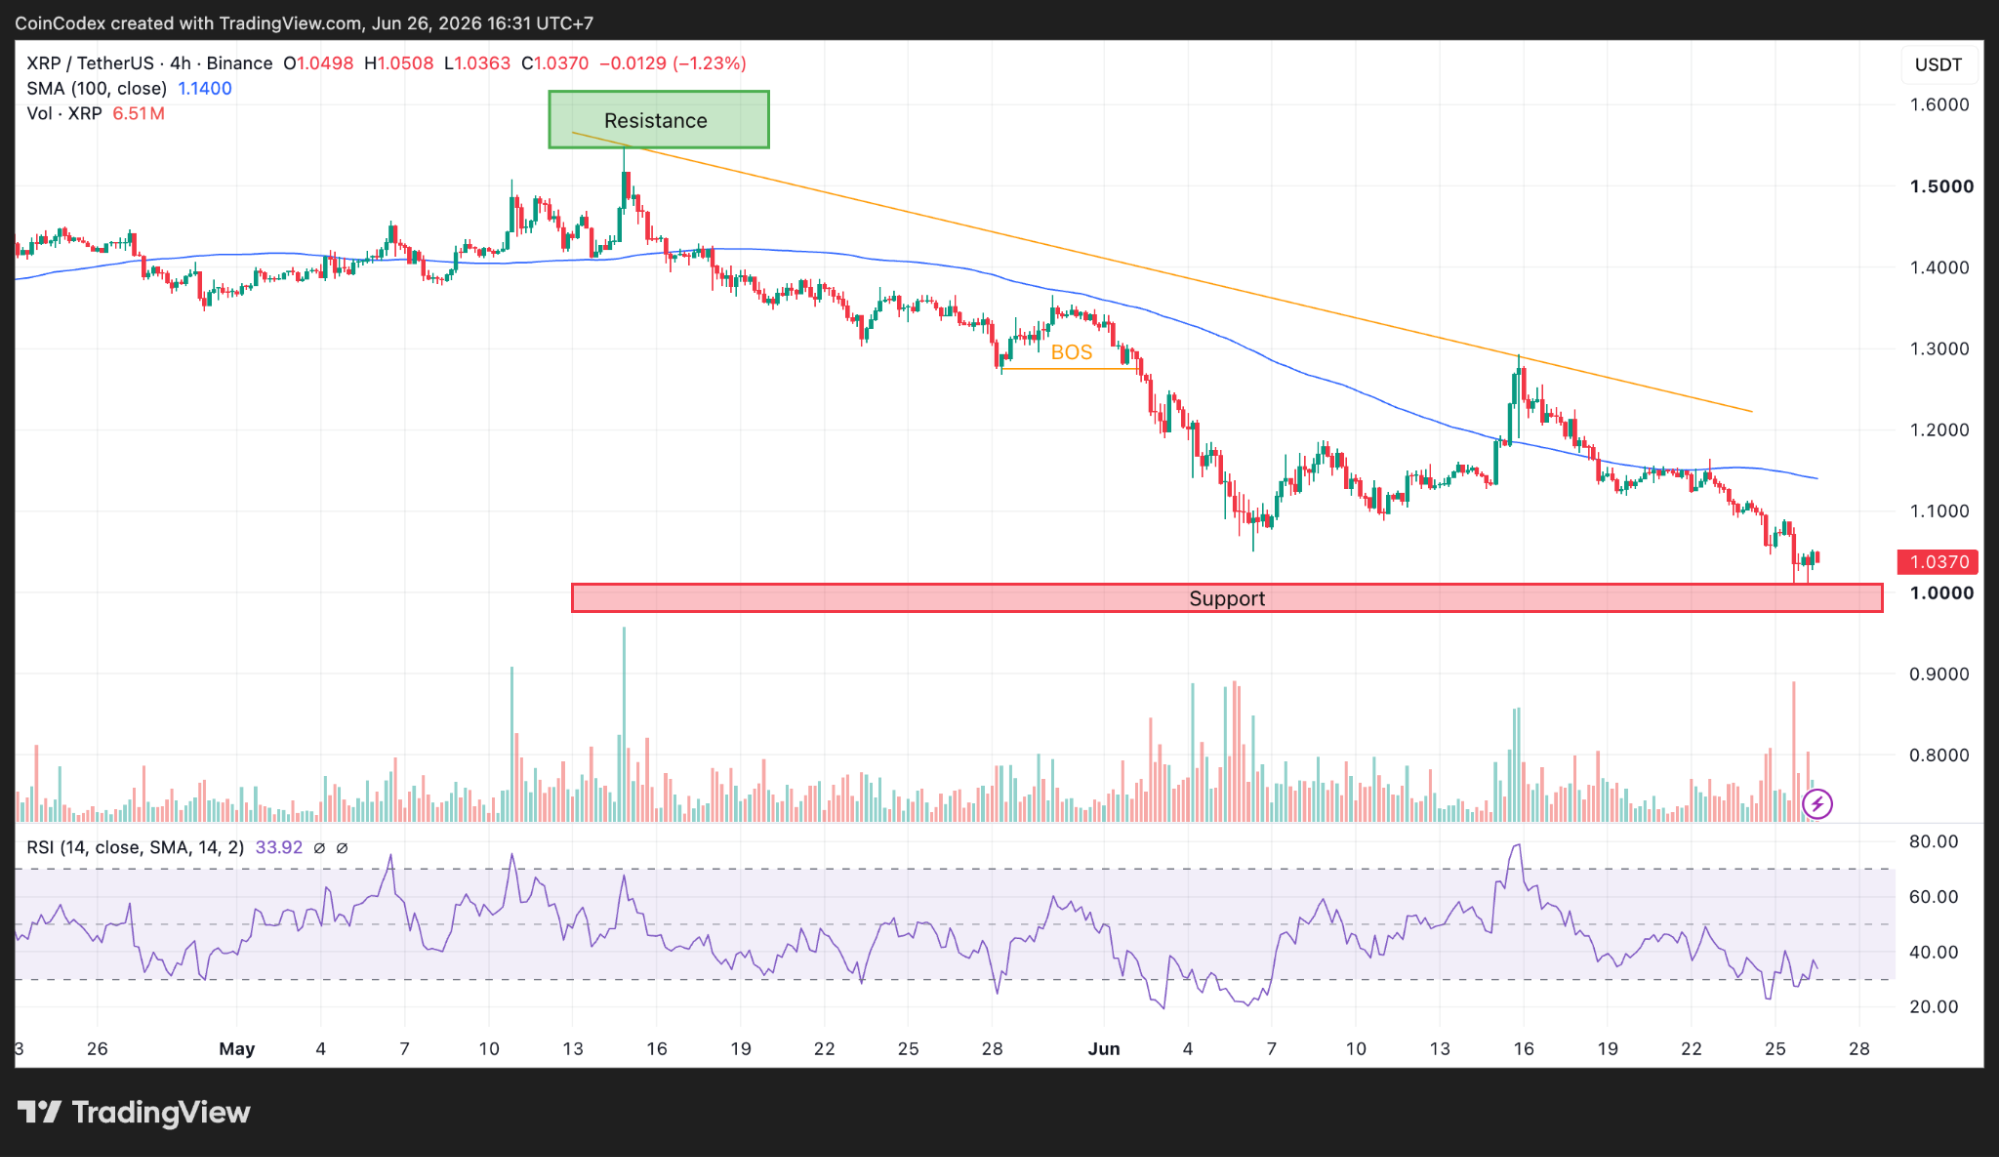
4-Hour XRP chart analysis
XRP has stayed below that moving average since early June, and the SMA continues sloping lower. Price action has also remained weak after falling from the $1.40 to $1.50 area reached in late May. The market continues producing lower highs and lower lows, keeping the broader trend pointed downward.
Momentum also remains soft. The 4-hour RSI is 33.92, placing it close to oversold territory without crossing below the traditional level of 30. The daily chart paints an even weaker picture.
The XRP price trades about 21.6% below the daily 100-day SMA at $1.3228. From the visible cycle high near $4.03, XRP has lost roughly 74% of its value. One indicator is beginning to stand out, though.
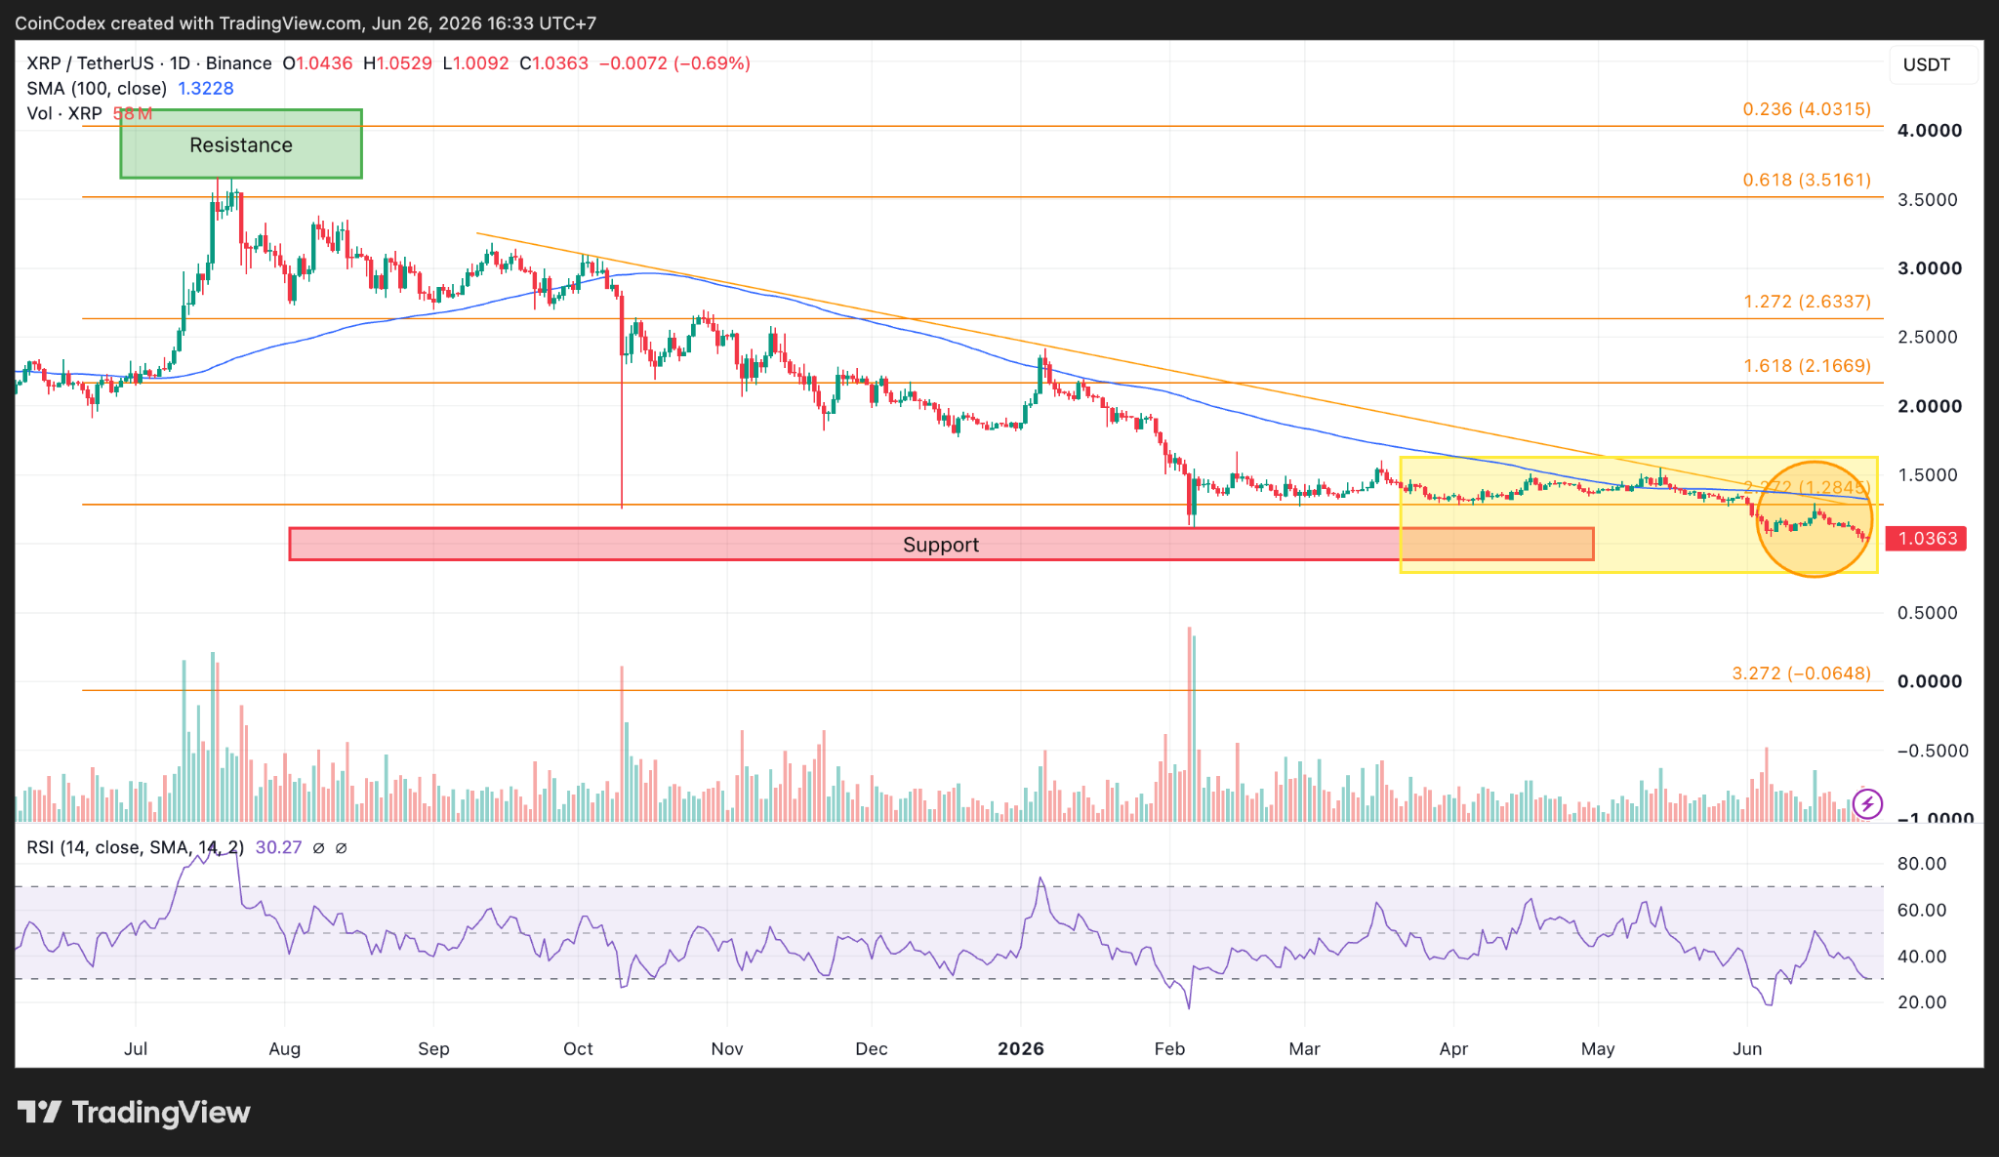
Daily XRP chart analysis
The daily RSI has dropped to 30.27, putting XRP inside oversold territory. Historically, readings near 30 often appear after extended periods of heavy selling. They don’t guarantee an immediate recovery, but they frequently appear before markets begin stabilizing.
For now, the first level attracting attention is $1.00. If sellers push below that mark, the next area comes in near $0.90, followed by the larger support zone around $0.878 identified on the weekly chart.
Regulation and new XRPL features could become bigger catalysts
The technical picture is only one part of the story. Ripple’s legal battle with the SEC has largely been resolved, removing one of the biggest sources of uncertainty surrounding XRP. Investors are now following the proposed CLARITY Act, which would formally establish digital asset classifications within the United States.
Many market participants believe legislation like this could open the door for institutional products tied to XRP. Standard Chartered has previously discussed the possibility of $4 billion to $8 billion in future ETF-related inflows if the regulatory framework continues improving.
The XRP Ledger is also moving forward with several major upgrades. Developers are working toward quantum-resistant security, with implementation targeted around 2028, alongside a proposed native lending protocol designed to expand decentralized finance on XRPL.
The network has also established a presence in tokenized real-world assets. Current market data places XRPL at roughly 63% of the tokenized U.S. Treasury market, giving it another area of growth beyond cross-border payments.
What could come next for the XRP price?
The XRP price is entering one of its most important technical zones in months. The weekly chart is still giving support to the bigger picture bullish trend structure, as long as the support level at $0.878 holds firm. However, on the shorter-term charts, sellers still dominate the trend.
The next major decision points remain $1.00 in the near term and $0.878 over the longer timeframe. Those levels may determine whether XRP begins building a stronger recovery or whether the correction has more room to run before the next major cycle begins.
According to CoinCodex’s 1-month XRP price prediction, the XRP price could climb toward $1.17, pointing to modest upside from current levels if buyers manage to defend the $1.00 support area and reclaim resistance around the 100-day moving averages.
Source:: XRP Price Prediction: Analysts Say XRP Could Rebound if This Key Level Holds